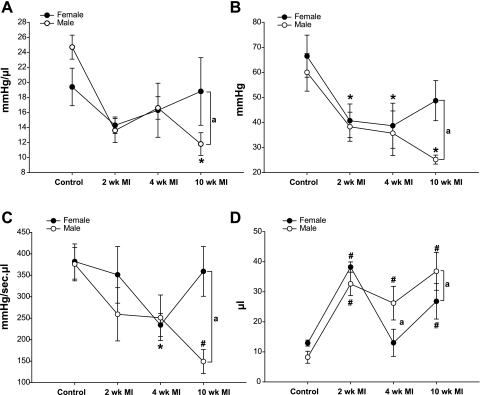
Fig. 2.
Measurements of left ventricular contractility obtained during transient occlusion of TVC and volume intercept at 2, 4, and 10 wk post-MI mice. A: slope of the end-systolic pressure volume relationship. B: preload recruitable stroke work. C: maximum dP/dt vs. maximum EDV. D: volume intercept, representing the x-axis intercept of the slope of the ESPVR. Data are means ± SE; changes are due to infarct. *P < 0.05, #P < 0.01 vs. respective controls and changes due to sex. aP < 0.05.

