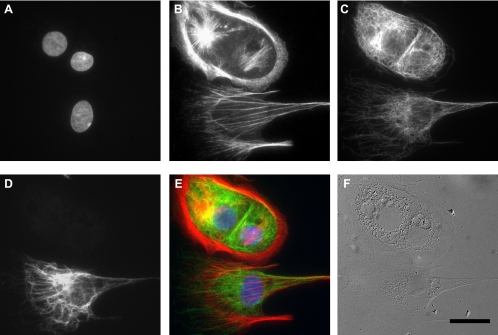
Fig. 6.
Coculture of primary alveolar epithelial cells and lung fibroblasts, as visualized via fluorescence (A–E) and DIC microscopy (F), showing nuclei (A), filamentous actin (B), α-tubulin (C), fibroblast-specific vimentin (D), and the resulting composite image (E). In particular, lung fibroblasts (positive for vimentin) were typically rich in linear actin stress fibers, whereas AT1 and AT2 epithelial cells (negative for vimentin) were mostly devoid of stress fibers, exhibiting a more diffuse actin distribution. Scale bar = 20 μm.

