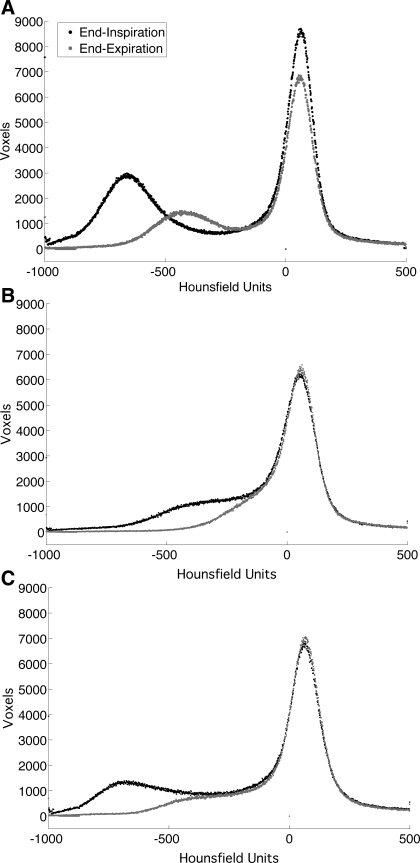
Fig. 1.
Representative end-inspiration (black tracing) and end-expiration (gray tracing) histograms from control (A), week 1 bleomycin-exposed (B), and week 3 bleomycin-exposed mice (C). Peak centered near 0 Hounsfield units (HU) is composed of the soft tissues of the mediastinal structures and the chest wall. The portions of the histogram that change with inhalation are derived from voxels containing lung parenchyma. Note increased density of the pulmonary voxels in bleomycin-exposed mice, particularly with end exhalation.

