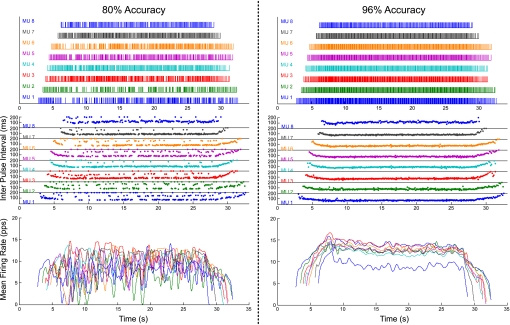
Fig. 1.
Decomposition results for 80% accuracy (left) and 96% accuracy (right) of the same underlying indwelling electromyographic (EMG) signal. In each case, there is a “bar plot” (top) showing the firing times for the decomposed motor unit action potential trains (MUAPTs), a “dot plot” (middle) showing the interpulse intervals for the decomposed MUAPTs, and a plot of the firing rate curves (bottom) derived for the 8 decomposed MUAPTs.

