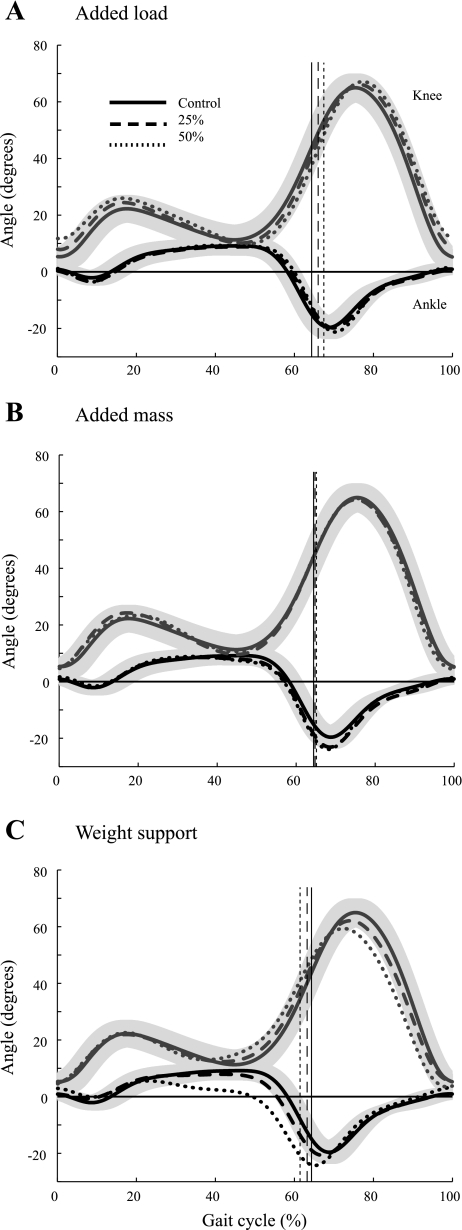
Fig. 2.
Knee (gray lines) and ankle (black lines) joint angles. Positive values for knee angle are joint flexion. Positive values for ankle angle are dorsiflexion, and negative values are plantar-flexion. Shaded regions represent ±1 SD for control data. Heel strike corresponds to 0% of the gait cycle, and thin vertical lines indicate the end of the support phase.

