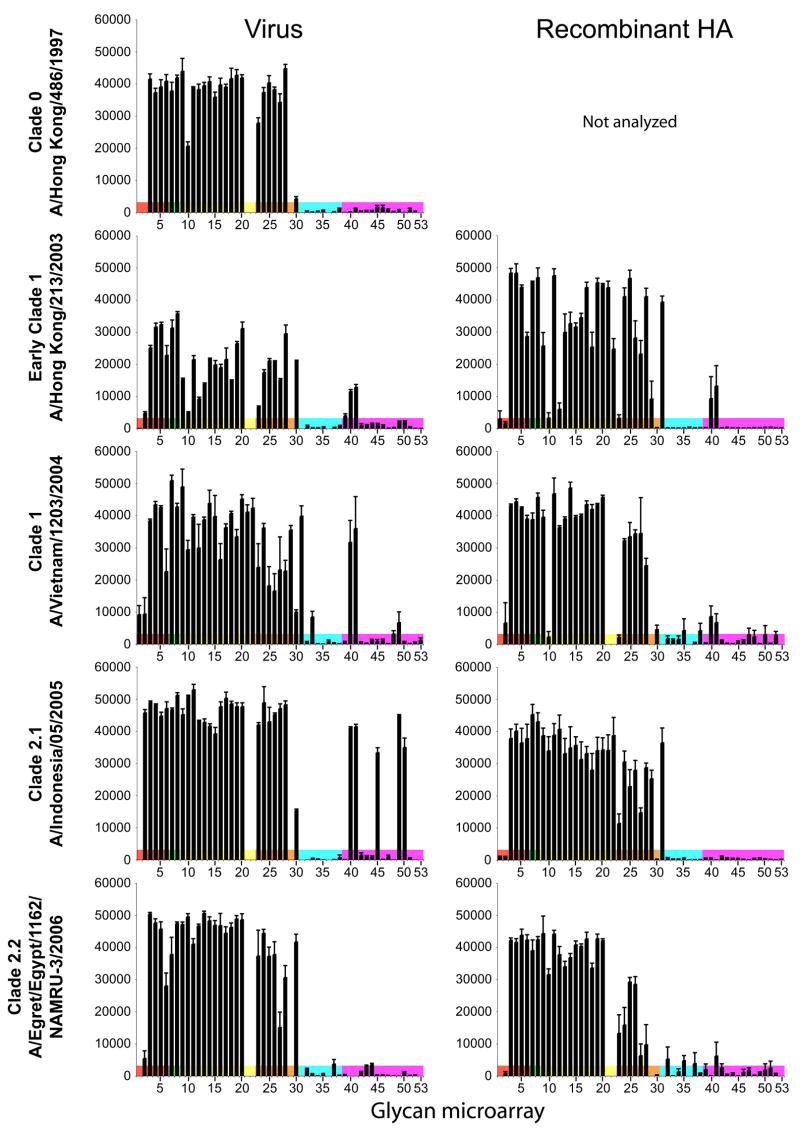
Fig. 3.
Comparison of receptor specificity of representative H5N1 viruses (column 1) and corresponding recombinant HAs (column 2) using a glycan microarray. A number of HAs from 1997 to 2005 isolated from human infections were analyzed and compared. Viruses were analyzed at a HA titer of 128 per 50μl while 15 μg of recombinant HA was used for the complementary analysis. Binding to different categories of glycans on the array are highlighted as follows: red, α2-3 sulfated; green, α2-3 di-sialylated, yellow, linear α2-3 sialosides; orange, fucosylated α2-3 sialosides; blue, α2-3 internal sialosides; and pink α2-6 ligands in same order as listed for the α2-3 sialosides (see Table 2 for name list and structures). Because additional glycans were added to the microarrays during the course of this study, glycans # 1, 21, 22, 29, 31, 36 and 53 are absent on certain graphs.

