

Abstract
Riboflavin Binding Protein (RBP) binds copper in a 1:1 molar ratio, forming a distinct well-ordered type II site. The nature of this site has been examined using X-ray absorption and pulsed electron paramagnetic resonance (EPR) spectroscopies, revealing a four coordinate oxygen/nitrogen rich environment. On the basis of analysis of the Cambridge Structural Database, the average protein bound copper-ligand bond length of 1.96 Å, obtained by extended x-ray absorption fine structure (EXAFS), is consistent with four coordinate Cu(I) and Cu(II) models that utilize mixed oxygen and nitrogen ligand distributions. These data suggest a Cu–O3N coordination state for copper bound to RBP. While pulsed EPR studies including hyperfine sublevel correlation spectroscopy and electron nuclear double resonance show clear spectroscopic evidence for a histidine bound to the copper, inclusion of a histidine in the EXAFS simulation did not lead to any significant improvement in the fit.
Introduction
Riboflavin Binding Protein (RBP) has been known for many years to be responsible for the active transport of riboflavin into the egg and for the storage of the riboflavin until it is needed in development. Recent studies have shown RBP binds copper in a one-to-one molar ratio under dialysis conditions.1 Bound copper is in the form of a well-ordered type II site.1 In addition, bound copper exists in a mixture of oxidation states, despite the absence of any external reducing agents during the introduction of copper II by dialysis under aerobic conditions.2
Metal binding has not yet been shown to have a defined biological function; however, there is some evidence that copper may be bound to the protein in its native environment.1 RBP is already known to be involved in the active transport of the cofactor riboflavin (Rf). The additional role of metal binding might be in the transport of copper, which is abundant in the egg and whose delivery to the egg is not completely understood. One established fact is that increasing copper intake in the diet of laying hens does not lead to excess copper in the eggs.3 This implies a tight regulation of the transport of copper into the egg, which is not surprising because, as a redox active metal, copper can catalyze many unwanted reactions if present in excess.
The mixture of redox states of copper bound to the RBP may also suggest a role in the safe storage of copper until it is needed for embryonic development. The egg poses its own unique set of problems in terms of metal transport and storage for oviparous species. In mammalian embryonic development, the mother supplies nutrients to the developing fetus throughout the growth cycle while for oviparous species all necessary nutrients must be delivered to the egg before laying it. Large amounts of vitamins, minerals, and other nutrients are transported to and stored in the egg complexed to transport proteins. Some transport proteins protect nutrients, while others prevent undesirable and even toxic chemical reactions. For example, reactive metal ions like copper must be kept in an inert state until needed to prevent extraneous and potentially hazardous redox activity.
The suggestion of any possible native function of RBP in the binding and transport of metals raises the question of how this interaction could have remained undetected for so long with so much study previously conducted on RBP. The answer to that question most likely lies in a combination of the unusual conditions involved in the traditional purification of RBP from eggs and in the fact that the function of RBP in the active transport of riboflavin was characterized. The traditional purification was optimized to protect the Rf binding. Because RBP is a protein and not an enzyme, there is no assay that can be done to show that it is intact and properly folded after purification except to confirm that it binds Rf. On a more practical note, bound Rf gives the protein its characteristic color, making it easy to isolate on elution columns. The low pI and high solubility of the RBP allows it to be separated from other egg proteins at very low pH on ion exchange and via differential precipitation. We have shown that when copper-loaded protein is dialyzed overnight against an elution buffer, bound copper is lost.4 If copper is bound to the egg in vivo, the established method of purification would certainly strip it.
The copper site in RBP has been identified by continuous wave-electron paramagnetic resonance (CW-EPR) and by X-ray absorption spectroscopy (XAS). It has a well-defined axial geometry (obtained by spectral simulation) with g∥ = 2.39 (A∥ = 142 G) and g⊥ = 2.065 (A⊥ = 10 G).4 Preliminary spectroscopic analysis of the metal center in RBP by XAS suggests that copper is ligated in an atypical coordination environment dominated only by low Z (oxygen/nitrogen) ligands.2 Initial CW-EPR experiments indicated copper hyperfine parameters that were more consistent with coordination by 3 to 4 oxygen ligands,4 likely in part because of hydration and carboxylate ligation by acidic residues. XAS analysis is most consistent with an average Cu-nearest neighbor coordination environment constructed by four disordered oxygen/nitrogen ligands at an average bond length of 1.96 Å. Spectral features, typically associated with imidazole multiple scattering, are observed in the extended x-ray absorption fine structure (EXAFS) data suggesting the possibility of histidine residues in the coordination environment of Cu bound to RBP. Inclusion of imidazole scattering was, however, not justified in the initial XAS simulations.2 A stable mixed-oxidation state copper site with all oxygen coordination is however unlikely. Copper (II) is medium-soft Lewis acid and favors coordination by softer Lewis bases such as nitrogen and sulfur. XAS clearly rules out sulfur ligation; however, the technique is unable to distinguish between nitrogen and oxygen unless long-range backscattering from the rigid histidine imidazole ring can be directly detected. The observed mixed oxidation state of the copper further weakens the argument against an all oxygen based ligand environment because such coordination would favor the oxidized copper (II) form. All of this evidence points to the involvement of histidine in the ligation of the bound copper. To clarify the possibility of imidazole ligation to copper, we have chosen to reexamine the atomic details of metal by XAS, as well as utilizing additional complementary spectroscopic methods to gain an enhanced understanding of the Cu center in RBP.
Electron Spin–Echo Envelope Modulation (ESEEM) techniques, including Hyperfine-Sublevel Correlation Spectroscopy (HYSCORE), have proven extremely useful in determining the interactions of copper bound to proteins with distant nuclei. Electron–Nuclear Double Resonance (ENDOR) studies provide similar information regarding directly coordinated nuclei. In the current manuscript we report further characterization of the copper site by pulsed EPR (ESEEM, HYSCORE, ENDOR) along with a refinement of the EXAFS data to include new information gleaned from the EPR data.
Experimental Section
Sample Preparation
RBP was purified from egg white according to published procedures.5 Lyophilized protein was resuspended in 0.10 M Tris, pH 7.2, and dialyzed overnight against buffer containing 10 mM CuCl2, followed by 0.10 M Tris to remove any excess copper. Protein (fully loaded with Rf) was quantified by its absorption spectrum according to the Kozik equation.6 Total copper content was measured by graphite furnace atomic absorption spectroscopy as previously reported.4 Protein for XAS analysis was concentrated and then dissolved in 30% ethylene glycol and water. Similarly prepared samples were studied by EPR.
EPR
CW and pulsed EPR experiments were carried out at 10 K on a Bruker E680X spectrometer equipped with an Oxford CF935 cryostat and either a 5 mm dielectric resonator or a 4 mM dielectric resonator equipped with an ENDOR accessory. CW-EPR spectra were simulated using the XSophe software package available from Bruker. Pulsed EPR data were simulated using Fortran and Matlab-based programs developed in the McCracken Laboratory at Michigan State University.
ESEEM
Stimulated echo, or 3-pulse, ESEEM experiments (90°−τ−90°−T−90°) were performed at 10 K using 16 ns full-width-half-maximum (fwhm) microwave pulses with peak powers of 250 W. A 4-step phase-cycle of (+x, +x, +x), (−x, +x, +x), (+x, −x, +x) and (−x, −x, +x) was used together with the appropriate addition and subtraction of subsequent echo intensities to remove distortions from 2-pulse echoes and the DC offset from the spectrometer's amplifiers. Spin echo intensities were measured using a 24 ns integration window.7 ESEEM spectra were obtained by fast Fourier transformation of the time domain data after removal of the background decay function and the application of a Hamming window. Absolute value spectra are shown.
ENDOR
Strong 14N hyperfine couplings were detected using the Davies ENDOR measurement. In this experiment a 3-pulse microwave excitation scheme, 180°−T−90°−τ−180°, is used to generate an electron spin echo at time τ after the last 180° pulse. A radiofrequency (rf) pulse of (T-2000) ns duration and 90 W peak power was applied during the period T after the inverting microwave pulse. The ENDOR spectrum is obtained by plotting the echo intensity versus the rf pulse frequency. To focus our ENDOR study on strongly coupled 14N, we used a high bandwidth microwave π-pulse of 60 ns fwhm.8,9
XAS
XAS was implemented to help characterize the metal–ligand coordination geometry, ligand identity, ligand symmetry, and metal oxidation state of copper bound to RBP. Multiple reproducible independent XAS samples were prepared at 1.65 mM protein/1.26 mM Cu concentrations in buffered 30% glycerol solutions. Samples were loaded into metal-free Lucite cells wrapped with Kapton tape. After preparation, samples were immediately frozen in liquid nitrogen and maintained at that temperature until data collection.
XAS data was collected at the Stanford Synchrotron Radiation Laboratory (SSRL) on beamline 10-2 using a Si[220] monochromator, detuned to 50% for harmonic rejection. During data collection, samples were kept at 10 K using an Oxford Instruments continuous-flow liquid helium cryostat. Protein fluorescence excitation spectra were collected using a 13-element Ge solid-state detector. Nickel filters (6 μm in width) and solar slits were placed between cryostat and detector to filter scattering fluorescence not associated with Cu signals. XAS spectra were measured using a 5 eV step in the pre-edge region (8750–8960 eV), 0.25 eV steps in the edge region (8986–9050 eV), and 0.05 Å−1 increments in the EXAFS region (to k = 13), integrating from 1 s to 20 s in k3 weighted manner for a total scan length of approximately 45 min. X-ray energies were calibrated with simultaneous measurement of a copper foil absorption spectrum, assigning the first inflection point to 8980.3 eV. Each fluorescence channel of each scan was closely monitored for spectral anomalies and for sample photoreduction. To avoid photoreduction, a small beamsize was utilized (1 × 2 mm) and the beam position was moved to a new spot on the sample after each scan. The data represents the average of a total of 8 scans.
XAS spectra were analyzed using the Macintosh OSX version of EXAFSPAK,10 integrated with the Feff v7 software for theoretical model generation.11 Protein EXAFS data were fit with both single and multiple scattering amplitude and phase functions calculated using Feff with crystallographically characterized copper models.4 Single scattering Feff models were generated for copper-oxygen, -sulfur, -carbon, and -copper environments while multiple scattering models were generated for copper-imidazole interactions. Single and multiple scattering theoretical models were utilized during data simulation with a static scale factor and a threshold energy of 1.0 and −12 eV, respectively. Data were simulated over the spectral k range of 1 to 12.85 Å−1, corresponding to a spectral resolution of 0.133 Å. When simulating empirical data, only the absorber-scatterer bond length (R) and Debye–Waller factor (σ2) were allowed to freely vary while metal–ligand coordination numbers were fixed at half-integer values. Criteria for judging the best fit simulation, and for adding ligand environments, included (a) a reduction in the mean square deviation between data and fit (F′), a value corrected for the number of degrees of freedom in the fit, (b) bond length differences consistent with out data resolution, and (c) all Debye–Waller factors values less than 0.006 Å2.
Cambridge Structural Database (CSD) Analysis
Small molecule copper–oxygen/nitrogen ligand structural correlations were obtained by searching the Cambridge Structural Database (CSD) library using the program ConQuest version 1.5.12 The oxidation state of copper was held to either Cu(I) or Cu(II), and the coordination numbers were held constant to be either 2, 3, or 4 during the search. Only oxygen and nitrogen based ligands were utilized in our search criteria. Bond length statistics were analyzed using the program Vista, integrated with ConQuest.
Results
EPR
The CW spectrum of copper loaded RBP has been previously reported.1,2 The site is a well-ordered type II site. Pulsed EPR experiments (ESEEM, ENDOR, and HYSCORE) were carried out in both the g∥ and g⊥ regions (fields marked by the black arrows in Figure 1).
Figure 1.
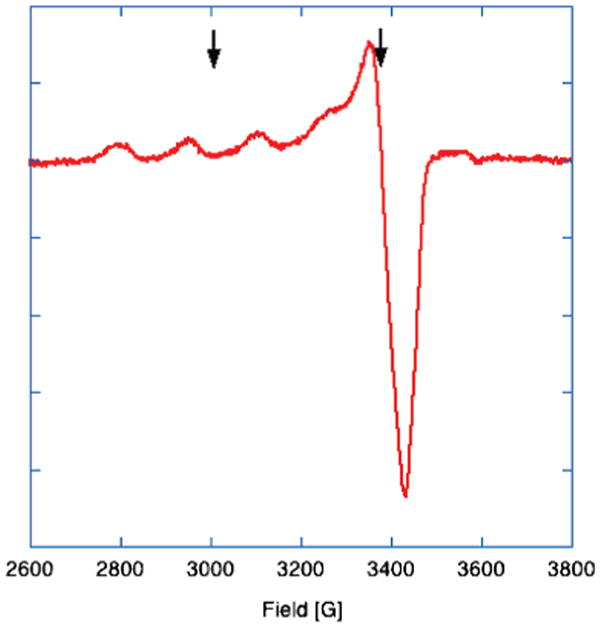
CW-EPR spectrum of 1.75 mM RBP (loaded to 1.26 mM Cu2+) in 0.1 M Tris, pH 7.2 collected. Microwave frequency: 9.7 GHz. Microwave power: 1 μW. Modulation frequency: 10 kHz. Modulation amplitude: 10 G. Temperature: 10K. The small signal visible at approximately 3600 G is an artifact of the cavity used for the measurements.
XAS
XAS studies were utilized to help reveal the average oxidation state and ligand coordination of copper bound to RBP. Protein was loaded with a sub-stoichiometric amount of Cu(II) to ensure all metal was bound to the protein. The X-ray absorption near edge structure (XANES) spectra (Figure 2) of copper bound to RBP is consistent in general structure to a complex coordination environment constructed of mixed oxidation states. Pre-edge features at 8978 and 8984 eV, indicative of 1s → 3d and 1s → 4p transitions respectively, suggest the presence of both Cu(II) and Cu(I). The intensity of the 1s → 3d pre-edge feature indicates that a high prevalence of copper is maintained in the cupric as-loaded form of the metal.
Figure 2.
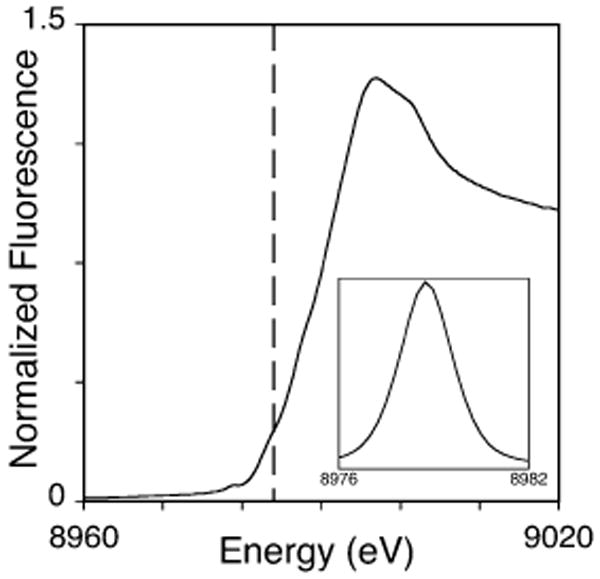
XANES region of the copper loaded RBP. Vertical dashed line indicates the region of a typical Cu(I) 1s → 4 p transition at 8984 eV. Inset shows the expansion of the background-subtracted 1s → 3d region of the XANES spectra of Cu(II) loaded RBP.
EXAFS simulations were used to characterize the ligand nearest neighbor structure for bound copper. The average coordination environment is constructed solely of oxygen/nitrogen ligands at an average bond distance of 1.96 Å. Neither Cu–S nor Cu–Cu environments could be identified in the copper bound RBP EXAFS. Long-range carbon scattering at 2.9 Å and 3.9 Å was identified in our simulations (Table 1). Structural features in the raw and Fourier transformed EXAFS are however qualitatively suggestive of histidine imidazole scattering. The camelback beat pattern at about k = 4 Å−1 in the EXAFS and long-range scattering features in the Fourier transform are characteristic of rigid imidazole scattering.13 In an attempt to identify and quantitate the apparent histidine scattering, multiple scattering fits were performed using a rigid imidazole model. While the data could be simulated with an imidazole model, these fits were not justified according to our rigid fitting criteria. Simulations for both the single and multiple scattering (i.e., imidazole) fits are presented in Figure 3.
Table 1.
Summary of EXAFS Fitting Results for Copper RBP (Best Fit in Bold)
| ligand environmenta | ligand environmenta | |||||||||
|---|---|---|---|---|---|---|---|---|---|---|
| sample | fit # | atomb | R(Å)c | C.N.d | σ2e | atomb | R(Å)c | C.N.d | σ2e | F′ f |
| RBP | 1g | O/N | 1.96 | 3.0 | 4.17 | 0.39 | ||||
| 2g | O/N | 1.96 | 3.0 | 4.17 | C/C | 2.97/3.92 | 0.5/1.5 | 1.79/3.44 | 0.35 | |
| 3h | NIm | 1.98 | 1.0 | 4.56 | O | 1.96 | 2.0 | 3.09 | 0.37 | |
Independent metal–ligand scattering environment.
Scattering atoms: O (Oxygen), N (Nitrogen), C (Carbon).
Metal–ligand bond length in Å.
Metal–ligand coordination number.
Debye–Waller factor in Å2 × 10³.
Number of degrees of freedom weighted mean square deviation between data and fit.
Fit using only single scattering Feff 7 theoretical models.
Fit using both single scattering Feff 7 model with an additional multiple scattering Fe–N(Imidazole) model, generated based on crystallographic coordinates listed in ref 17,17 and labeled NIm in table atom designation. Details of fitting are described in the Experimental Section.
Figure 3.
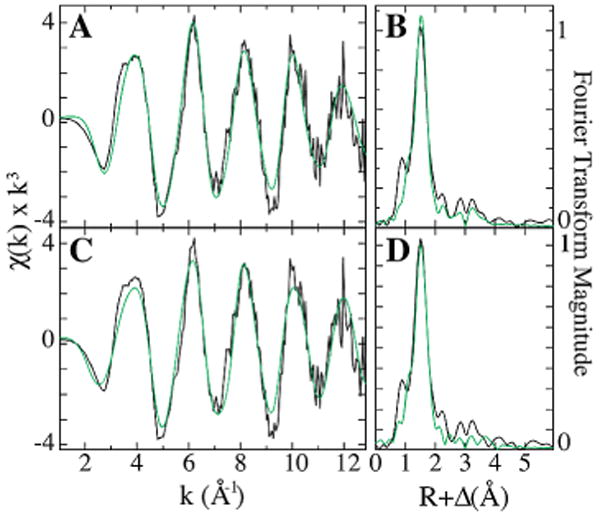
EXAFS and Fourier transforms of copper loaded RBP XAS data. Raw EXAFS spectra in black (A and C) along with the corresponding Fourier transform (B and D). Simulations of EXAFS and Fourier transform data for the best single scattering (A and B) and best multiple scattering (C and D) fits are shown in green.
CSD Analysis
An evaluation of the structural parameters for copper models within the CSD was performed. Our goal was to see if there is a correlation for average Cu–O and Cu–N bond lengths measured for a variety of metal valence states and mixed oxygen and nitrogen ligand types in small molecules as compared to the average value obtained from the protein data simulation. All models with sulfur ligation were excluded from the CSD search criteria, given the absence of any sulfur ligation in our Cu-RBP EXAFS. Oxygen and nitrogen ligand ratios were varied between two, three, and four coordinate Cu(I) and Cu(II) model compounds. Under these possible structural constraints, a number of “hits” were observed. Structural parameters from these hits were utilized when calculating both the average Cu–O, Cu–N and the weighted averaged Cu–O/N bond lengths for the models (Supporting Information, Table 1). General correlations observed from the CSD analyses showed that inclusion of nitrogen ligands generally lengthened the average Cu–O/N bond lengths, compared to models with only strict oxygen based ligands. A comparison of these CSD model average correlations to the averaged Cu–O/N bond length obtained for RBP suggests that our 1.96 Å average bond length obtained from protein fits more closely mimic the average Cu–O/N bond length obtained from 4 coordinate Cu(I) and Cu(II) models with mixed oxygen and nitrogen ligands.
ESEEM
Electron Spin–Echo Envelope Modulation (ESEEM) uses a series of two or three microwave pulses to flip and then refocus the spin packets in a sample; the resulting echo modulation contains information about the hyperfine frequencies of nuclei in the vicinity of the unpaired spin, in the current example, a bound Cu2+ ion. In the 3-pulse stimulated echo experiment, three 90° pulses are applied separated by times T and τ (90°−τ−90°−T−90°); a stimulated echo is then formed by the refocusing of the spin packets at time τ after the last 90° pulse. As T is increased in an incremental fashion, a modulation function is collected of the echo in the time-domain, which can then be analyzed by Fourier transform methods to give nuclear hyperfine frequencies for nuclei coupled to the electron spin.
Three-pulse ESEEM data were collected in the g⊥ region of the CW-EPR spectrum (3370 G) at τ values of 136, 208, and 280 ns. This data (shown in Figure 4 for τ = 136 ns) clearly shows the deep modulations commonly observed for histidine bound to copper and, in the frequency domain, the three low frequency peaks (at 0.59, 0.89, and 1.57 MHz) and the broader peak at approximately 4 MHz (four times the Larmor frequency of 14N at the field value of 3370G). This spectrum is typical of the remote nitrogen of strongly bound histidine ligand and the hyperfine coupling regime known as “exact cancellation”. For 14N ESEEM spectra of this type, the three narrow low frequency peaks come from an electron spin manifold where hyperfine and nuclear Zeeman interactions cancel one another and the resulting ligand hyperfine frequencies are determined by the nuclear quadrupole interaction. Simulation of the ESEEM spectrum using only the single 14N was very successful (Figure 4, dotted line).
Figure 4.
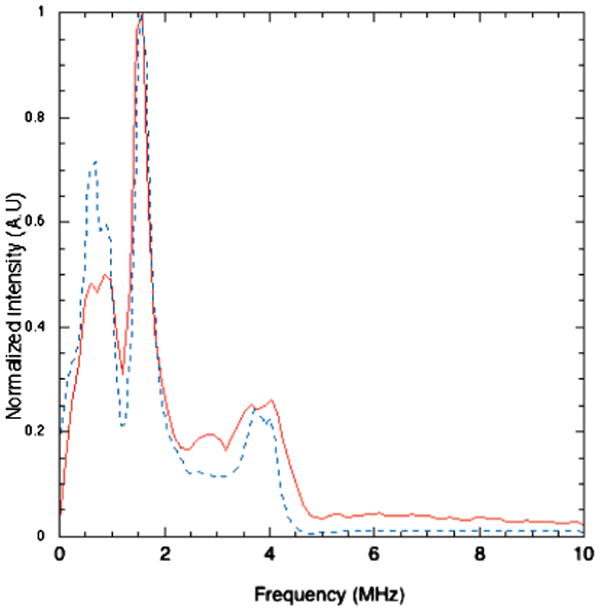
(a) Three-pulse ESEEM spectrum in both the time domain (a) and frequency domain (b, solid line) shown with simulation (dashed line) for 1.7 mM copper loaded RBP in 0.1 M Tris, pH 7.2, collected at 3370 G; 90°−t−90°−T−90° sequence with 16 ns pulses; t value, 136 ns; T increment, 16 ns; scans, 4; and sample temperature, 10 K. The simulation parameters for 14N nitrogen; Axx =1.10 Ayy= 1.40 MHz, Azz=1.70 MHz, e2qQ = 1.5 MHz, and η = 0.90 with the nuclear quadrupolar interaction axes at 90° from the principal axis system.
HYSCORE
To probe for the presence of a second, strongly bound histidine imidazole ligand, 4-pulse HYSCORE spectra were collected. These spectra allow one to resolve peaks that occur at frequencies that are combinations of the ESEEM frequencies that stem from each electron spin manifold. For example, if the spectrum in Figure 4 arose from two separate 14N couplings of identical strength, crosspeaks at combination frequencies of 0.6, 0.9, and 1.6 MHz coupled to the 4 MHz double quantum peak should be resolved. A HYSCORE spectrum taken under identical conditions to the ESEEM spectrum of Figure 4 shows no evidence for such peaks (Figure 5). Because the HYSCORE spectrum provides a clean spectral window to observe combination peaks, these data verify that the copper (II) of RBP is coordinated by a single, strongly-bound histidine imidazole ligand.
Figure 5.
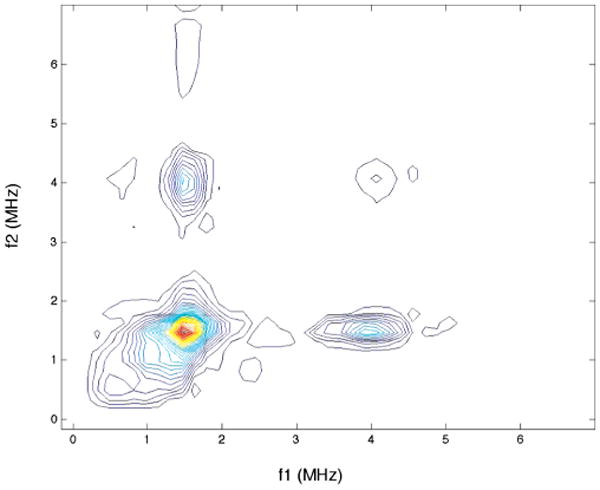
HYSCORE spectrum of 1.7 mM copper-loaded RBP collected at 9.682 GHz, 3370 G. τ = 140 ns, T1 = T2 = 40 ns, Tinc = 24 ns.
ENDOR
To support the above assignment of the 14N ESEEM to the remote nitrogen of a bound hystidine, we applied Davies ENDOR spectroscopy for the purpose of measuring ligand hyperfine coupling to the directly coordinated 14N. In Davies ENDOR, a microwave pulse sequence of 180°−T−90°−τ−180° is used to generate electron spin echoes while a radio frequency pulse of a discrete frequency is applied during the free procession period. An increase in electron spin echo amplitude is detected if the rf pulse is resonant with the NMR transitions of a coupled nucleus. In this way, nuclear transitions of directly coupled nuclei can be probed, but in the case of frozen aqueous solutions, there is often substantial interference from weakly coupled “matrix” protons. This interference can be mitigated by the appropriate choice of microwave pulse-widths to suppress frequencies associated with 1Hs in the sample9 as in the current experiment where short, hard microwave pulses of 56, 28, and 60 ns were applied. This suppression is not perfect, but by comparison of the spectra with others run with softer pulses, one can determine which absorptions are associated with protons in the sample/matrix. ENDOR transitions result in two frequencies symmetric about the nuclear Larmor frequency and separated by A, the hyperfine coupling constant.
Figure 6 shows data collected at 3380G where the 14N ENDOR response is centered at 17 MHz. The peaks visible at lower frequencies than 15 MHz (centered at the proton Larmor frequency at this field of 14.3 MHz) can be attributed to protons. For strongly coupled 14N, ENDOR frequencies are given by νENDOR = |A/2 ± νn|; at 3380 G, νn for 14N is 1.04 MHz. Only the ENDOR transitions associated with the 14N from the coordinated histidine are included in the simulation.
Figure 6.
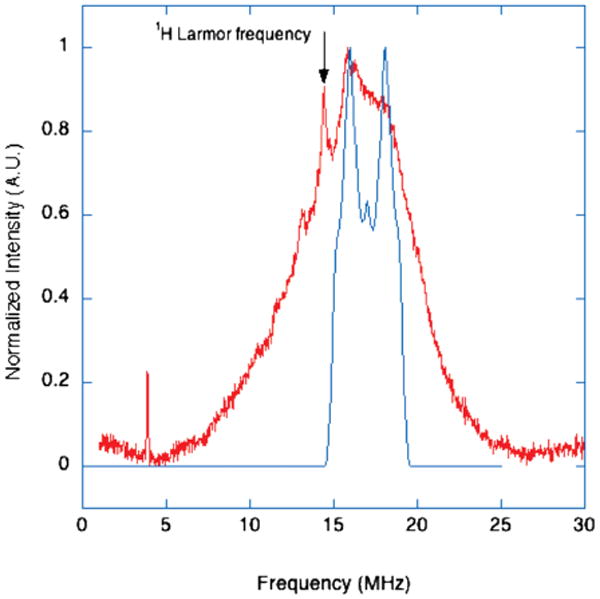
Davies ENDOR spectrum of 1.7 mM copper-loaded RBP collected at 3380 G, 9.723 GHz, 10 K. 180°−T−90°−τ−180° sequence with 56, 28, 60 ns pulses; τ value, 500 ns; T, 10000 ns. An RF pulse of 8000 ns duration was applied during T. The simulation parameters for 14N nitrogen; A0 = 34 MHz, e2qQ = 1.5 MHz, and η = 0.90 with the nuclear quadrupolar interaction axes at 90° from the principal axis system.
Discussion
Initial analysis of the XANES and EXAFS data led to an assignment of an oxygen/nitrogen based first coordination sphere with the copper existing in a mixed oxidation state. Pulsed EPR techniques have significant advantages for the detection of both ligands directly coupled to a paramagnetic center and also of other magnetic nuclei situated near such a center, but outside of the first coordination sphere. The 3-pulse ESEEM data immediately confirms the presence of a nitrogen in the coordination sphere of the copper based on the hyperfine and nuclear quadrupolar coupling constants determined from simulation of the data. The quadrupolar coupling constant, e2qQ, of 1.5 MHz and an asymmetry parameter, η, of 0.90, are commensurate with those observed in single crystal Cu(II)-histidine model systems.14 While the 14N ENDOR spectrum is somewhat obscured by the contribution of the matrix 1Hs, there is clear evidence for the existence of a nitrogen directly coordinated to the copper center. The hyperfine coupling constant of 34 MHz measured for the directly coordinated nitrogen is in agreement with values measured by Hoffman and co-workers for type I copper proteins like stellacyanin.15 The unequivocal assignment of this signal as a histidine comes from the combination of an exact cancellation nitrogen with appropriate nqi parameters for a histidine, together with the strongly coupled, directly coordinated nitrogen in the Davies ENDOR. In this combination of techniques, we are seeing both the directly bound nitrogen and the remote nitrogen of a single histidine ligand.
The HYSCORE spectrum, collected at 3380 G in the g⊥ region is very simple with correlation peaks only in the (+,+) quadrant (centered at [1.5, 4.0 MHz], ν+ from the ms = +1/2 manifold, and the 4 MHz band from the ms = −1/2 manifold). This correlation peak is expected and is parallel to the axes, indicating nitrogen at almost perfect exact cancellation conditions.16 The absence of combination-frequency crosspeaks confirms that there is only a single histidine in the coordination sphere of the copper center as indicated in the simulation of the ESEEM and ENDOR data.
In spite of the clear evidence for imidazole coordination from pulsed EPR, inclusion of an imidazole in the EXAFS simulation was not justified, although CSD analysis indicates that the average protein Cu–O/N bond length obtained from RBP EXAFS analysis is only consistent with a nitrogen scatterer included in the Cu-nearest neighbor ligand environment. Possible explanations for an inability to justifiably fit an imidazole bound to copper in RBP include the mixture of copper oxidation states in the sample and some small amount of conformational freedom in the imidazole binding. Identification of long-range EXAFS scattering attributed to histidine coordination relies on scattering from both the bound nitrogen and the remote nitrogen (similar to our assignment of the EPR signals to a histidine). If there is some disorder in the position of the remote nitrogen, then it can be difficult to simulate the EXAFS for the histidine13,17 The EXAFS sample contains a mixture of copper (I) and copper (II), possibly contributing to such conformational disorder. Furthermore, if a portion of the imidazole is bound to Cu(I) and a portion bound to Cu(II), there may be enough of a discrepancy between individual bond lengths to destructively eliminate the resolvable copper–histidine scattering. These issues are, of course, eliminated in the EPR data because that technique only sees the copper (II) site.
In summary, there is clear spectroscopic evidence for the formation of a four coordinate O3N type II copper site in RBP upon dialysis against a buffer containing CuCl2. This copper is partially reduced even under aerobic conditions, and in the absence of external reducing agents, this implies that the protein itself is somehow responsible for the reduction of the copper. The presence of the histidine in the first coordination sphere of the bound copper is not surprising; in fact, it would be more surprising to find no evidence for such binding. Oxygenic ligands stabilize oxidized copper while nitrogen ligands stabilize the reduced form. Mixed ligation may provide a means to control the desired redox state of the metal. Studies are ongoing to identify the binding site and to establish a native role for this interaction in the avian embryo.
Supplementary Material
Acknowledgments
This work was supported by a grant from the Office of the Vice Provost of Research at the University of Michigan (S.R.S., M.B.P.), and by the National Institute of Diabetes and Digestive and Kidney Diseases R01DK068139 (T.L.S.). We thank the Matt Krzyaniak and the McCracken laboratory and the Michigan Center for Structural Biology at Michigan State University for the generous use of the EPR facilities. Portions of this research were carried out at both the Stanford Synchrotron Radiation Laboratory (SSRL). SSRL is a national user facility operated by Stanford University on behalf of the U.S. Department of Energy, Office of Basic Energy Sciences. The SSRL Structural Molecular Biology Program is supported by the Department of Energy, Office of Biological and Environmental Research, and by the NIH, National Center for Research Resources, Biomedical Technology Program.
Footnotes
Supporting Information Available: A table of CSD analysis for the small molecule copper–oxygen/nitrogen ligand library (PDF). This material is available free of charge via the Internet at http://pubs.acs.org.
References
- 1.Smith SR, Pala I, Benore-Parsons M. J Inorg Biochem. 2006;100(11):1730–1733. doi: 10.1016/j.jinorgbio.2006.06.015. [DOI] [PubMed] [Google Scholar]
- 2.Smith SR, Benzce K, Wasiukanis K, Parsons MB, Stemmler T. Open Inorg Chem J. 2008;2:39–41. doi: 10.2174/1874098700802010022. [DOI] [PMC free article] [PubMed] [Google Scholar]
- 3.Richards MP. Poult Sci. 1997;76:152–164. doi: 10.1093/ps/76.1.152. [DOI] [PubMed] [Google Scholar]
- 4.Lieberman RL, Kondapalli KC, Shrestha DB, Hakemian AS, Smith SM, Telser J, Kuzelka J, Gupta R, Borovik AS, Lippard SJ, Hoffman BM, Rosenzweig AC, Stemmler TL. Inorg Chem. 2006;45(20):8372–8381. doi: 10.1021/ic060739v. [DOI] [PMC free article] [PubMed] [Google Scholar]
- 5.Miller MS, White HB., III Methods Enzymol. 1986;1986(122):227–234. doi: 10.1016/0076-6879(86)22174-6. [DOI] [PubMed] [Google Scholar]
- 6.Kozik A. Biochim Biophys Acta. 1982;704:542–545. [Google Scholar]
- 7.Gemperle C, Schweiger A. Chem Rev. 1991;91(7):1481–1505. [Google Scholar]
- 8.Yang TC, Hoffman BM. J Magn Reson. 2006;181(2):280–286. doi: 10.1016/j.jmr.2006.05.011. [DOI] [PubMed] [Google Scholar]
- 9.Doan PE, Fan C, Davoust CE, Hoffman BM. J Magn Reson. 1991;95(1):196–200. [Google Scholar]
- 10.George GN, George SJ, Pickering IJ. EXAFSPAK. Menlo Park, CA: 2001. http://www-ssrl.slac.stanford.edu/∼george/exafspak/exafs.htm. [Google Scholar]
- 11.Rehr JJ, Ankudinov AL. J Synchrotron Radiat. 2001;8(2):61–65. doi: 10.1107/s0909049500016423. [DOI] [PubMed] [Google Scholar]
- 12.Bruno IJ, Cole JC, Edgington PR, Kessler M, Macrae CF, McCabe P, Pearson J, Taylor R. Acta Crystallogr, Sect B. 2002;B58:389–397. doi: 10.1107/s0108768102003324. [DOI] [PubMed] [Google Scholar]
- 13.Stemmler TL, Sossong TR, Ash DE, Elgren T, Kurtz D, Penner-Hahn JE. Biochemistry. 1997;36(32):9847–9858. doi: 10.1021/bi9702795. [DOI] [PubMed] [Google Scholar]
- 14.Colaneri MJ, Peisach J. J Am Chem Soc. 1992;114(13):5335–5341. [Google Scholar]
- 15.Werst MM, Davoust CE, Hoffman BM. J Am Chem Soc. 1991;113(5):1533–1538. [Google Scholar]
- 16.Deligiannakis Y, Rutherford AW. J Am Chem Soc. 1997;119(19):4471–4480. [Google Scholar]
- 17.Riggs-Gelasco PJ, Stemmler TL, Penner-Hahn JE. Coord Chem Rev. 1995;114:245–286. [Google Scholar]
Associated Data
This section collects any data citations, data availability statements, or supplementary materials included in this article.