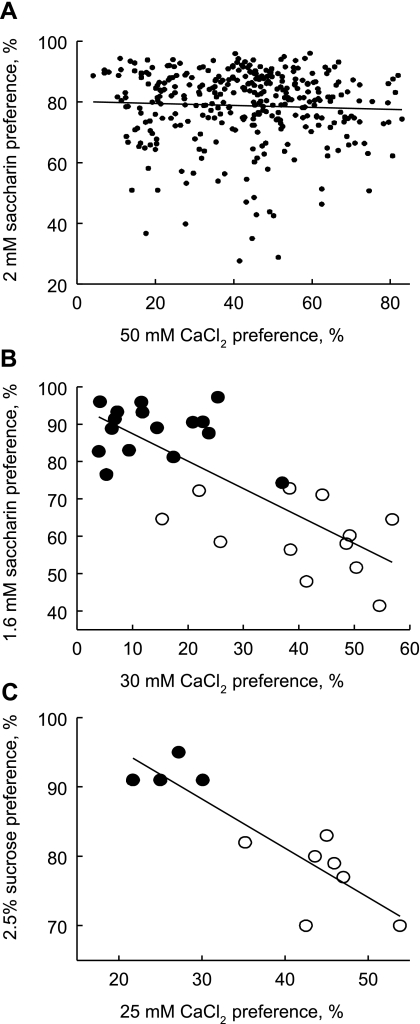
Fig. 6.
Scatter plots showing relationship between preferences for calcium and sweeteners in: (A) 480 B6 × PWK F2 hybrid mice (r = −0.05, not significant); (B) males of 28 inbred strains with 30 mM CaCl2 preference from Ref. 1 and 1.6 mM saccharin preference from Ref. 32 (r = −0.77, P < 0.00001); (C) males of 11 strains with 25 mM CaCl2 preference from Ref. 44 and 2.5% sucrose preference from Fig. 2 of Ref. 16 (r = −0.87, P = 0.0005). •, B6 genotype at rs13478082, which is believed to confer high sweet preference; ○, alternate genotype at rs13478082.

