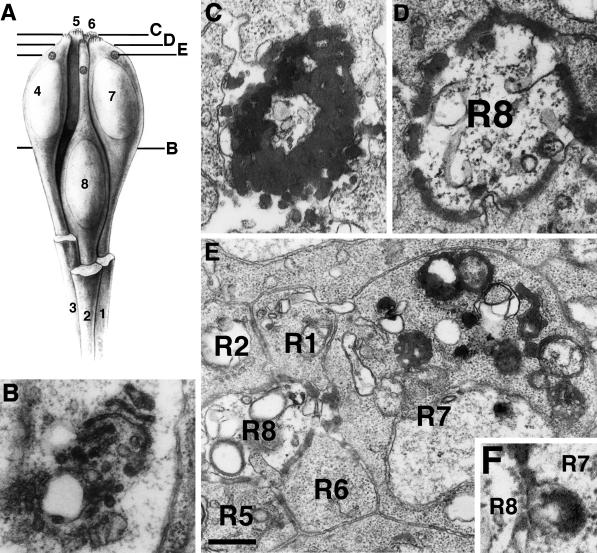
Figure 4.
The HRP-Boss chimera reveals Boss trafficking on the ultrastructural level. (A) Schematic drawing of a developing ommatidium indicates the relative position of the eight photoreceptor cell bodies (1–8), which can be identified based on their shapes and their specific contacts to neighboring cells (Wolff and Ready, 1993). Photoreceptor cells R1–R3 in the front are broken away to reveal the central R8 cell and the neighboring R7 cell. The levels of EM sections in B–E are indicated in the diagram. At the R8 perinuclear level (B), HRP activity was detected in the stacks of the Golgi complex of R8 cells. No labeling was detected on the basolateral R8 cell surfaces. From the Golgi complex, HRP-Boss was transported to the apical microvilli of R8 cells (C). In sections just below the microvilli (D), the apical R8 cell surface was specifically labeled by HRP activity. At a slightly more basal level (E), the specific uptake of HRP-Boss into R7 cells was revealed. Whereas weak HRP staining was sometimes observed in cells other than R7, especially R3, R4, and cone cells, only R7 cells consistently exhibited the dramatic staining of the multitude of vesicular and vacuolar structures that constitute the endocytic compartment. (F) Occasionally, we observed patches of stained R8 cell surface pulled into the R7 cell. A was reprinted with modifications from (Krämer et al., 1991) by permission from Nature (copyright 1991 Macmillan Magazines Ltd.). Relevant genotypes were w1118; P[w+, gen.HRP-Boss]17; boss1. Bar: B and D, 0.25 μm; C, 0.3 μm; E, 0.4 μm; F, 0.16 μm.

