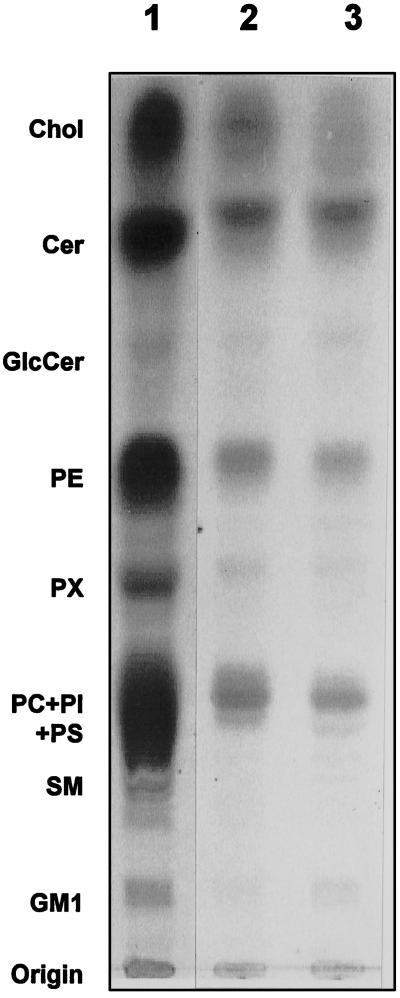
Figure 7.
Lipid analysis of untreated and TX-100–treated GPI-enriched membranes. Untreated (lane 2) and TX-100–treated (lane 3), GPI-enriched membranes pelleted from one gradient (150 × 106 cells) were suspended in 200 μl of water and extracted in 4.8 ml of chloroform:methanol:pyridine:water (60:30:1:6 by vol) at 50°C for 48 h in sealed Pyrex tubes. For comparison total lipids were extracted from 200 × 106 cells (lane 1). The lipid extracts were desalted by reverse phase chromatography, applied to TLC plates (Silica Gel 60), and chromatographed in chloroform:methanol:0.22% aqueous CaCl2 (60:35:8 by vol). Lipids were detected by staining with a solution of phosphomolybdic acid (2.5%), cerium-IV-tetrahydrate (1%) containing 6% (vol/vol) concentrated sulfuric acid, followed by heating (Arni et al., 1996). Lipids were identified by comparing their migration coefficient values with those of the standards.

