Figure 4.
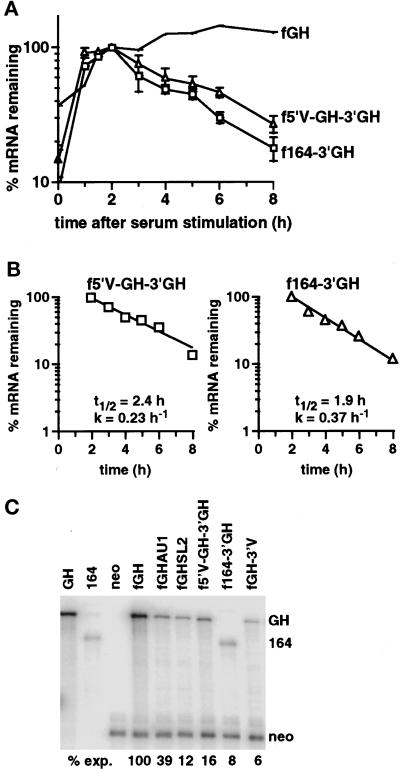
The VEGF 5′UTR and 164 amino acid coding region destabilize the reporter mRNA. (A) Time courses of degradation from cells expressing the fGH mRNA, the f5′V-GH-3′GH mRNA (▵), or the f164–3′GH mRNA (□) grown under normoxic conditions. The graph shows data as mean ± SEM for at least three independent experiments, normalized with respect to GAPDH. The levels of serum induction observed for each experiment were 9.6-, 4.4-, and 8.6-fold for the f5′V-GH-3′GH reporter gene and 23-, 16-, 12-, and 14-fold for the f164–3′GH reporter gene. The maximal levels of induction (expressed as a ratio to the GAPDH level) were 0.35, 0.29, and 0.32 for the f5′V-GH-3′GH reporter gene and 0.28, 0.22, 0.31, and 0.28 for the f164–3′GH reporter gene. (B) Decay kinetics of the f5′V-GH-3′GH and f164–3′GH mRNAs. The graph shows mean data taken from A, with the background level of mRNA from the unstimulated samples subtracted. Regression lines, calculated half-lives (t1/2), and decay rates (k) are indicated. (C) RNase protection analysis of RNA isolated from stably transfected BALB/c3T3 cells expressing the indicated chimeric genes. Cells were grown in 7.5% FCS under normoxic conditions. The first threelanes show the protection products obtained with growth hormone (GH), 164 amino acid coding region (164), or neo probes alone. The remaining lanes show protection products found with cells expressing the stable fGH mRNA, the fGH mRNA with AU-destabilizing elements (fGHAU1) (Brown et al., 1996), the fGH mRNA with the stem-loop destabilizing element from G-CSF (fGHSL2) (Brown et al., 1996), or the f5′V-GH-3′GH, f164–3′GH, or fGH-3′V mRNAs. The level of each mRNA was normalized with respect to the neo mRNA. The expression level relative to fGH is indicated below each lane.

