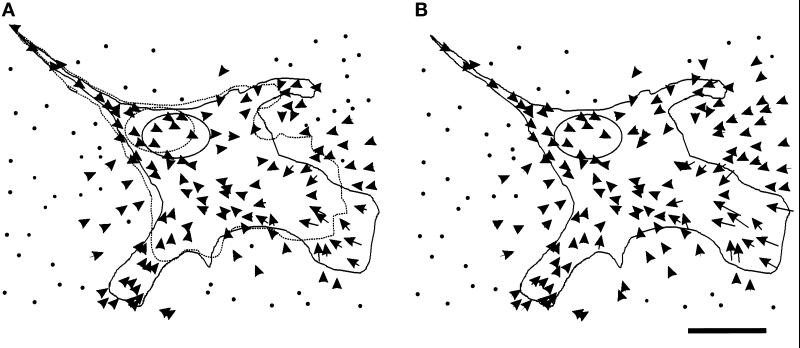
Figure 1.
Distribution of substrate deformation caused by a motile 3T3 cell. (A) The dotted line represents the cell boundary at t = 0 min, and the solid line represents the cell boundary at t = 30 min. Arrows show changes in the position of substrate-embedded beads as the cell migrated forward during this period of time. (B) At t = 30 min, the cell was detached from the substrate with trypsin. Arrows were constructed from the bead positions after cell detachment to those before detachment and reflect the net forces exerted by the cell. To facilitate plotting, the scale of the arrows was amplified twice relative to the scale of the cell (this also applies to all subsequent figures). The arrows show a radial pattern converging in a region just in front of the nucleus. Bar, 20 μm.

