Figure 2.
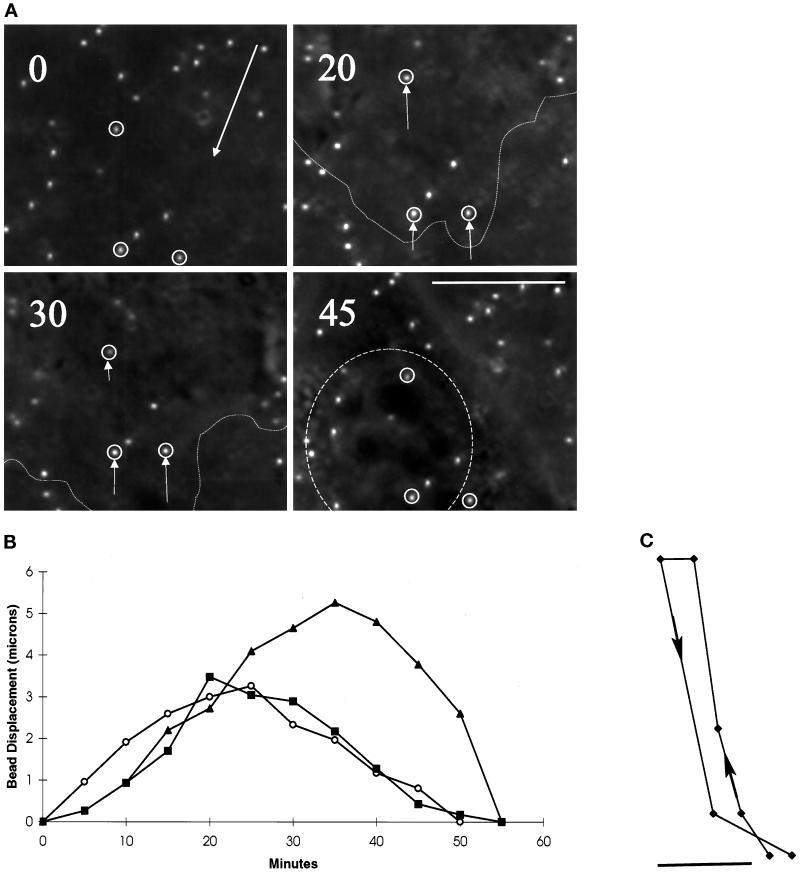
Changes in substrate deformation in the anterior region of motile cells. (A) The movement of substrate-embedded beads under the anterior portion of a motile cell was recorded at the time (in minutes) indicated in the top left corner. Small arrows indicate the positions of the several beads relative to their neutral positions at t = 0. The direction of cell movement is indicated by a large arrow at t = 0. The boundary of the cell is indicated by a dotted line at t = 20 and 30 min. The position of the nucleus is indicated by a dashed circle at t = 45 min. Strong deformation developed in a region ∼5–10 μm from the active leading edge and dissipated as the nucleus moved over the beads. Bar, 10 μm. (B) The magnitude of substrate deformation is plotted as a function of time for three beads from three different locomoting cells. The deformation reached its maximum in ∼25 min and then dissipated over the next ∼30 min without showing a measurable plateau. (C) The track of a bead moving under the anterior region of a cell follows a smooth course, with no detectable fluctuation in direction. Bar, 1 μm.

