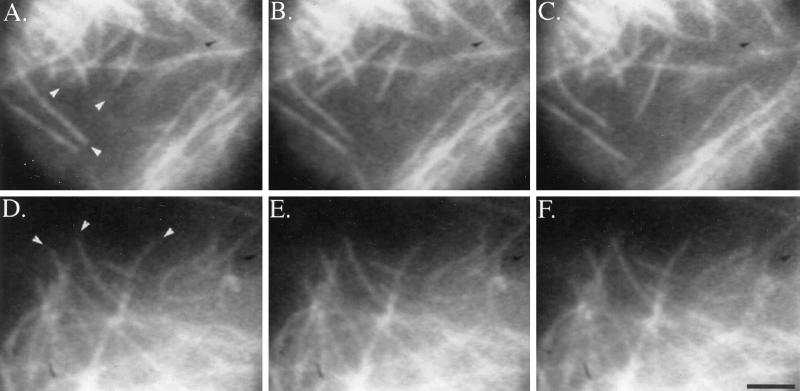
Figure 2.
Dynamic behavior of microtubules in living Caov-3 cells in the absence of drug (A–C) or incubated with 30 nM taxol for 4 h (D–F). Images were collected at 2-s intervals; panels shown are 10 s apart. Arrowheads in A indicate microtubules that undergo growing and shortening events. Arrowheads in D indicate stable microtubules. Bar, 2 μm.

