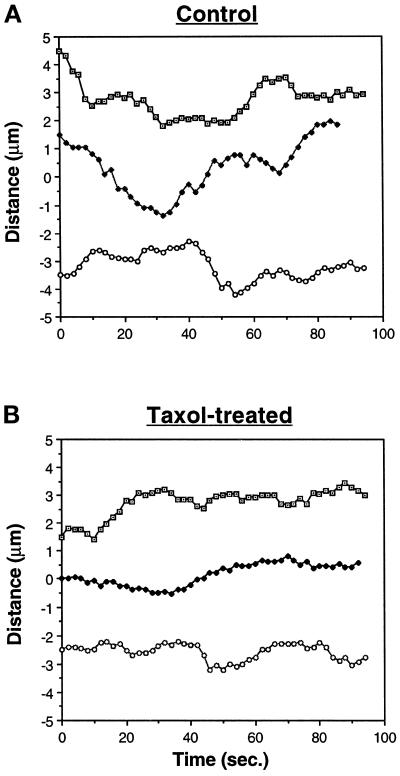
Figure 3.
Life history plots of microtubules in control (A) and taxol-treated (B) Caov-3 cells. The graphs represent the excursions made by individual microtubules during an 86- to 94-s observation period. Microtubules in the presence of taxol are characterized by longer pause events and less extensive growing and shortening events than those in control cells. The plots are offset on the y-axis for clarity.

