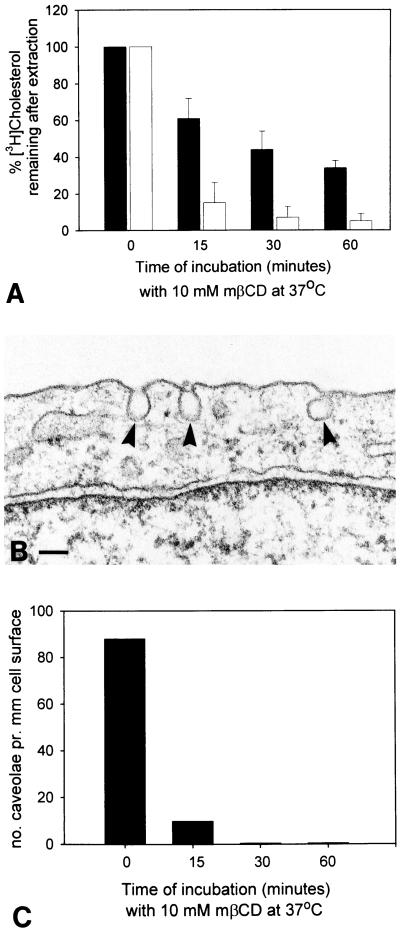
Figure 6.
Effect of MβCD on cellular cholesterol and invaginated caveolae. A shows the percentage of [3H]cholesterol remaining in HEp-2 cells after extraction with MβCD as indicated. Black bars represent cells incubated with [3H]cholesterol for 20 h, whereas open bars are cells incubated for 15 min. Data from three independent experiments with samples performed in quadruplicate. Mean ± SD; n = 3. B shows characteristic invaginated caveolae (arrowheads) as observed in HEp-2 cells (without incubation with MβCD). Bar, 100 nm. In C, the frequency of such caveolae has been quantified after cholesterol extraction with MβCD as indicated; pooled data from two of the three experiments shown in A.

