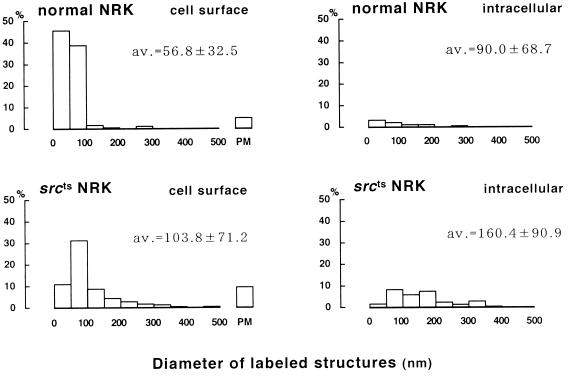
Figure 6.
Quantitative analysis of the distribution and size of sc-894–positive structures in immunoelectron microscopy of ultrathin cryosections. Vesicles and caveolae were classified into “cell surface” and “intracellular,” depending on whether a portion of them existed within 200 nm from the plasma membrane. The proportion of intracellular labeling in srcts NRK cells (29.6%) was significantly more frequent than in normal NRK cells (7.9%) (χ2 test for independence, p < 0.0001). PM, labeling in the seemingly flat portion of the plasma membrane most likely corresponds to both shallow caveolae and IMP-free flat areas seen in freeze replicas; its proportion in the cell surface labeling was also significantly larger in srcts NRK cells than in normal NRK cells (χ2 test for independence, p = 0.0087). Moreover, the diameter of the labeled structures was significantly larger in srcts NRK cells than in normal NRK cells (Mann–Whitney U test: cell surface, p < 0.0001; intracellular, p = 0.0011).

