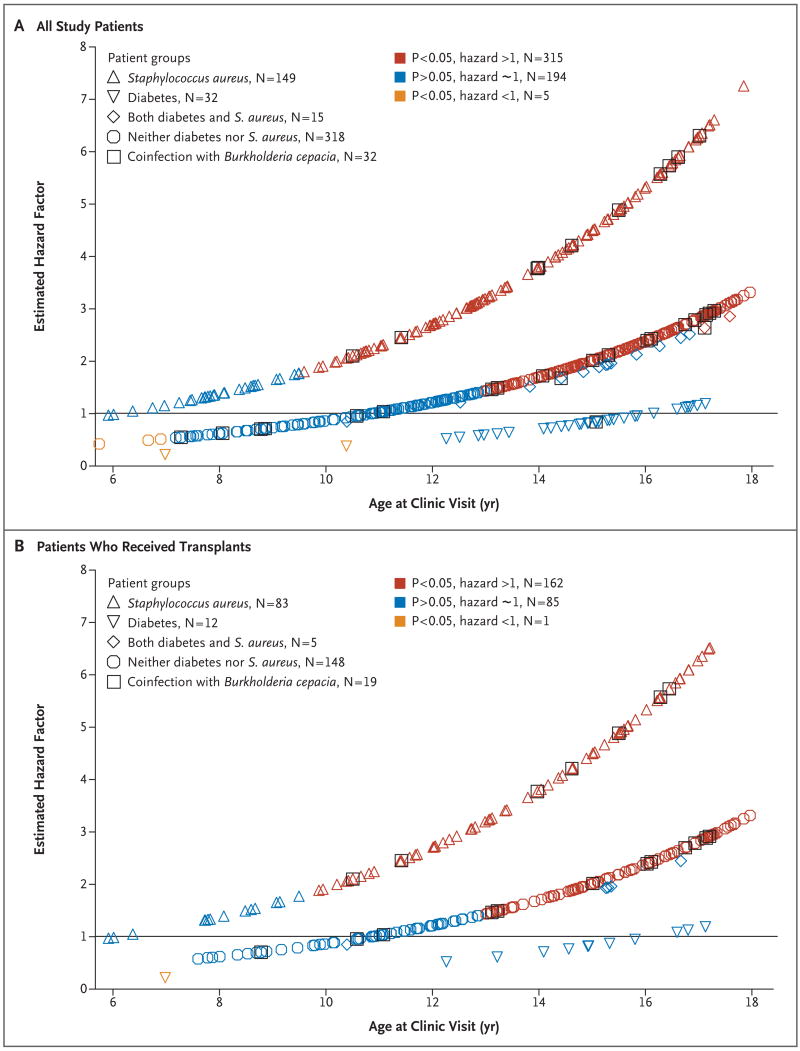
Figure 2. Estimated Hazard Factors Due to Lung Transplantation.
Panel A shows the estimated hazard factors due to lung transplantation calculated for each of the 514 patients in the study, plotted as a function of age. Blue symbols denote the lack of power to determine a significant risk of harm or benefit from transplantation. Red symbols denote a significant risk of harm, and orange symbols a significant benefit. Patients are grouped according to four curves that correspond to the presence of either, both, or neither of the binary variables (S. aureus infection and diabetes). The variable of B. cepacia infection does not interact with transplantation. The value of each hazard factor and the level of significance of each factor within each group at both extremes of age, where the data are sparse, should be viewed with caution, since they may have been the result of overextrapolation of the data. Unfortunately, all five of the patients with an apparently significant decrease in hazard factors (orange symbols) were included in this uncertain category. Panel B shows the estimated hazard factors due to lung transplantation for the 248 patients who underwent the procedure during the study period. These hazard factors are plotted as a function of age. Blue symbols denote the lack of power to determine a significant risk of harm or a significant benefit from transplantation. Red symbols denote a significant risk of harm, and orange symbols denote a significant benefit. A significant decrease in the hazard factor (orange symbol) is apparent for only one patient.

