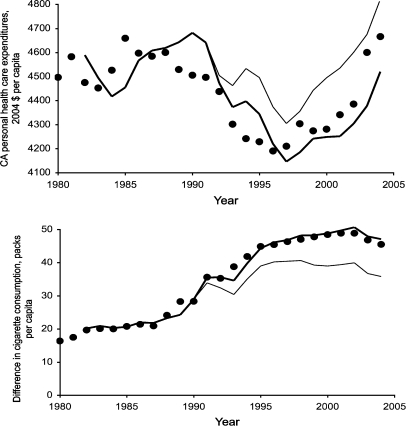
Figure 2. Effect of California Tobacco Control Program on Personal Health Care Expenditures and Cigarette Consumption.
The observed (dots) and predicted personal health care expenditures (top graph) and difference in cigarette consumption between the control states and California (bottom graph) with (darker lines) and without (lighter lines) tobacco control expenditures show that the program had a substantial effect on both variables. The dynamic predictions of per capita California health care expenditure, hCA,t, uses predicted values for difference in cigarette consumption, (scontrol,t − sCA,t), that are generated by dynamic predictions using Equations 1–4. The endogenous variables hCA,t and (scontrol,t − sCA,t) are generated from the estimated equations and observed exogenous variables for these dynamic predictions. In this figure the prediction for California health care expenditure uses predicted difference in cigarette consumption from Equations 2 and 4 as an explanatory variable rather than observed (as it was in Figure 1, top graph), which increases the prediction error in this more vigorous test of the model. The vertical differences between the darker and lighter solid lines show the effect of the CTCP expenditures.

