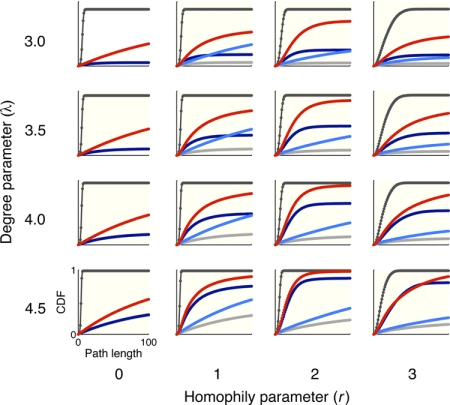
Fig. 3.
Empirical CDF (cumulative distribution function) of path length in Poisson networks as a function of degree and homophily parameters. Each plot shows the proportion of searches completed within a given path length. The x axis in each plot ranges from 0 to 100; the y axis ranges from 0 to 1. The color-coding is the same as in Fig. 1.

