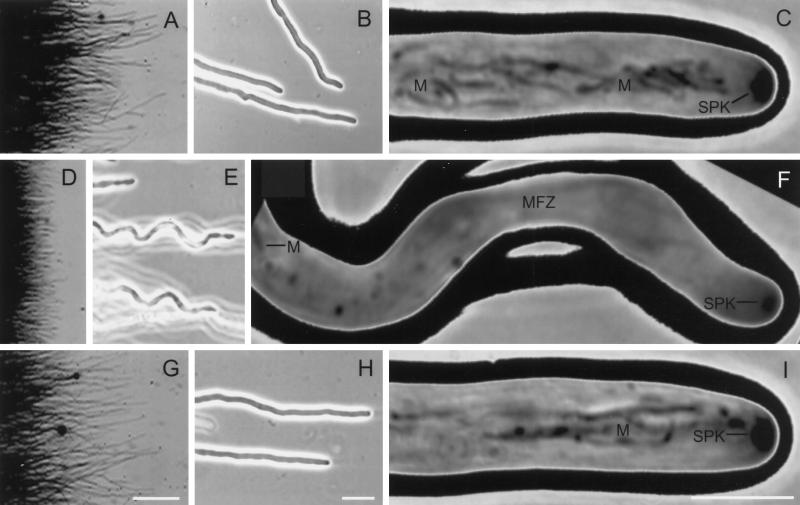
Figure 4.
Videomicrographs depicting the development of distinctive mycelial, hyphal, and cellular characteristics of Nhkin1− deletion mutant TSN25 relative to those of NhKIN1+ transformant TSN20 and WT. (A), (D), and (G), Reverse dark-field images of colony margins of WT (A), TSN25 (D), and TSN20 (G), illustrating the relatively larger number of hyphal tip cells arranged more uniformly in the mutant (D) than in the other two isolates. (B), (E), and (H) Phase-contrast images. At low magnification, the mutant tip cells (E) exhibit a regular undulation that describes a spiral in three dimensions, whereas the WT (B) and TSN20 (H) exhibit relatively straight growth. (C), (F), and (I) Phase-contrast images. High magnification of apical portions of living hyphal tip cells, to illustrate some of the effects of NhKIN1 deletion on organelles. In the mutant cell (F), mitochondria (M) do not occupy the apical region (MFZ, mitochondria-free zone) as they do in the WT (C) and TSN20 (I) cells. Also, the Spitzenkörper (SPK) in the mutant is smaller than in either the WT or TSN20 cells. Bars: (A), (D), and (G), 0.5 mm; (B), (E), and (H), 20 μm; (C), (F), and (I), 5 μm.

