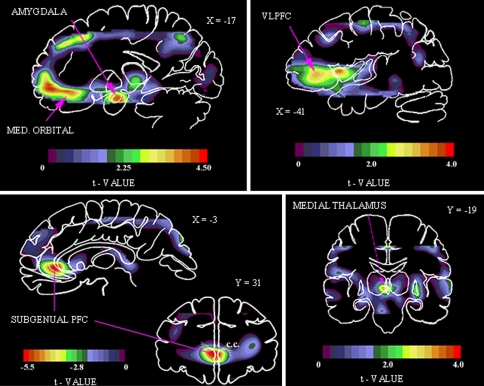
Fig. 3.
Areas of abnormally increased physiological activity in familial MDD shown in images of unpaired t values, which were computed using a statistical parametric mapping approach to compare activity between depressives and controls (Drevets et al. 1992, 1997). Upper left the positive t values in this sagittal section located 17 mm left of midline (X = −17) show areas were CBF is increased in depressives versus controls in the amygdala and medial (MED) orbital cortex (reproduced from Price et al. 1996). Upper right positive t values in a sagittal section 41 mm left of midline (X = −41) show areas where CBF is increased in the depressives in the left ventrolateral PFC (VLPFC), lateral orbitofrontal C, and anterior insula (reproduced from Drevets et al. 2004). Lower right positive t values in a coronal section located 19 mm posterior to the anterior commissure (Y = −19) shows an area where CBF is increased in the depressives in the left medial thalamus (reproduced from Drevets and Todd 2005). Lower left coronal (31 mm anterior to the anterior commissure; Y = 31) and sagittal (3 mm left of midline; X = −3) sections showing negative voxel t values where glucose metabolism is decreased in depressives relative to controls. The reduction in activity in this prefrontal cortex (PFC) region located in the anterior cingulate gyrus ventral to the genu of the corpus callosum (i.e., subgenual) appeared to be accounted for by a corresponding reduction in cortex volume (Table 1; reproduced from Drevets et al. 1997). Anterior or left is to left

