
Figure 6.
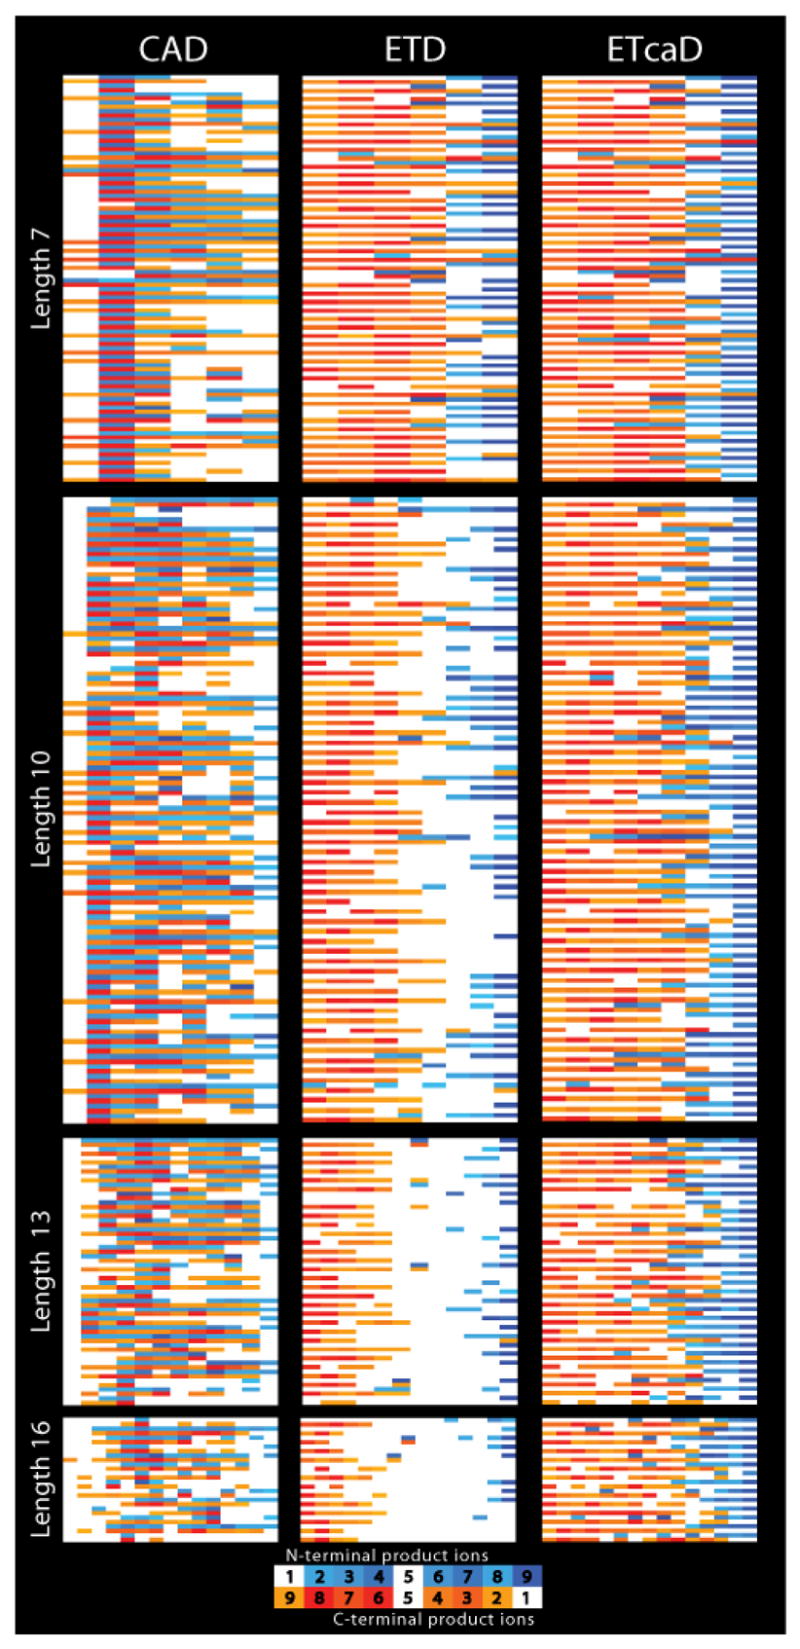
Fragmentation data array that summarizes the performance of CAD, ETD, and ETcaD for doubly charged peptide precursors ranging from 7 to 16 amino acids in length. Observed fragment ions from each peptide are depicted in two rows; N-terminal product ions are shown from left to right in blue, while C-terminal products are displayed from right to left in orange. Color intensity correlates with observed product ion intensity. Note for ETD a significant gap in sequence coverage becomes increasingly apparent as the peptide size increases. This gap is substantially minimized by use of ETcaD.