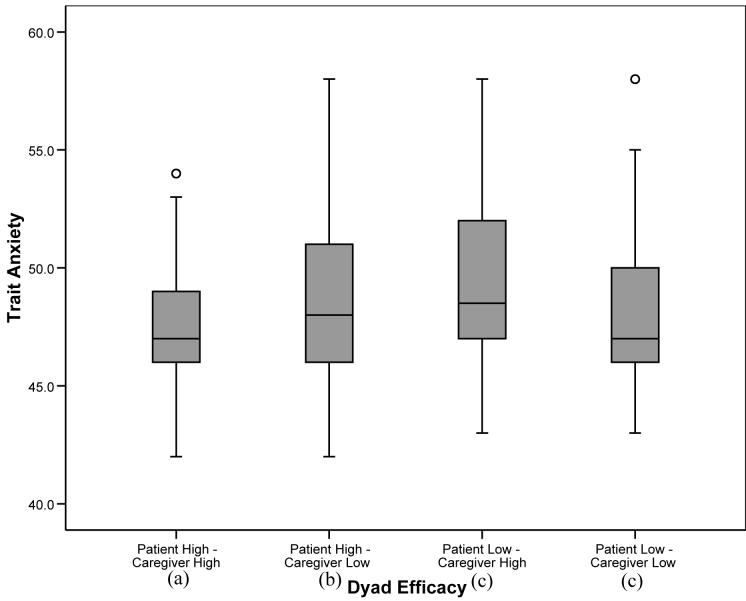
Figure 1.
Box plots displaying patient anxiety by dyad self-efficacy category. Medians are indicated by the horizontal line within each box, the 25th and 75th percentiles by the upper and lower boxes, nearest values not beyond 1.5 times the interquartile range with whiskers, and outliers with dots. The overall weighted least squares analysis was significant (p<.0001). Groups with differing subscripts differed significantly from each other (p’s<.01).

