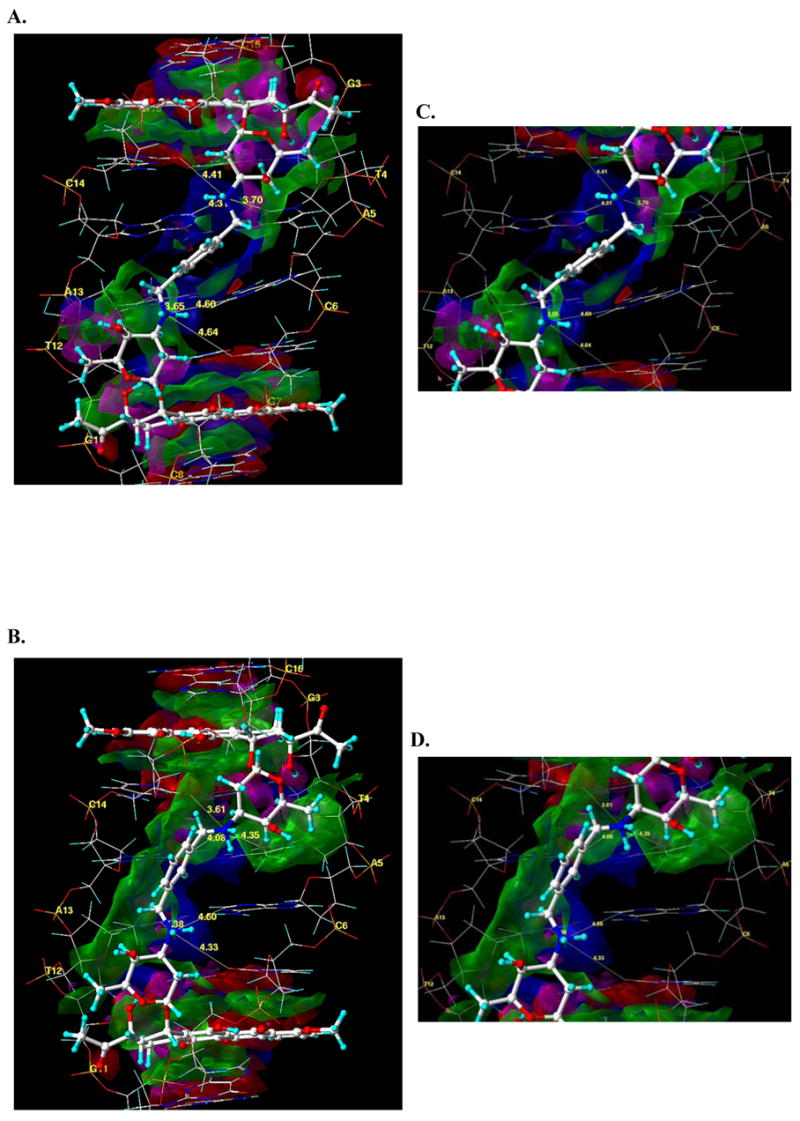
Figure 6.

HINT interaction maps for the interaction of WP631 (A) and WP762 (B) with the 5′-GC|GTAC|GC-3′ base pair sequence of DNA, which displays, visually, the quality and magnitude of the various binding contacts involved in the interaction. The contour surfaces are color-coded by interaction type at a constant map density value of ±150. Blue surfaces represent favorable polar interactions, red surfaces represent unfavorable polar interactions; Green surfaces represent favorable hydrophobic interactions, magenta surfaces represent unfavorable hydrophobic interactions. The interatomic distance between the N3′ ammonium groups on the WP631 and WP762 sugar rings and select atoms of the surrounding base pairs of DNA is also indicated. At right are close-up views of the xylenyl linker region in the average structures of WP631 (C) and WP762 (D), indicating six hydrogen bonds (yellow lines) between the quaternary ammonium and various base pairs in the DNA.
