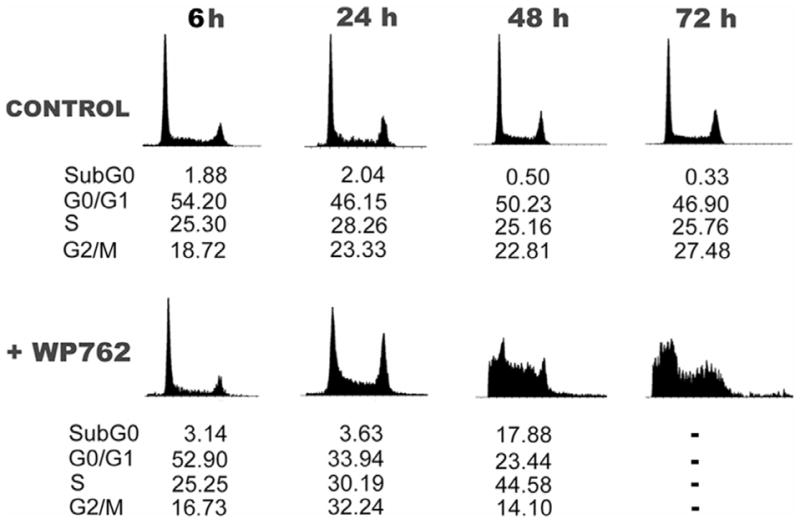
Figure 7.

Flow cytometry analyses of Jurkat T cells treated with WP762. Cell cycle distribution was determined at the time intervals indicated. Data indicate the percentage of cells in each phase. (A) Cell cycle distribution of untreated Jurkat T cells. (B) Cell cycle distribution in the presence of 54 nM WP762 (its IC75). Transient changes in G2/M and sub-G1 peaks were evident after treatment.
