Figure 2.
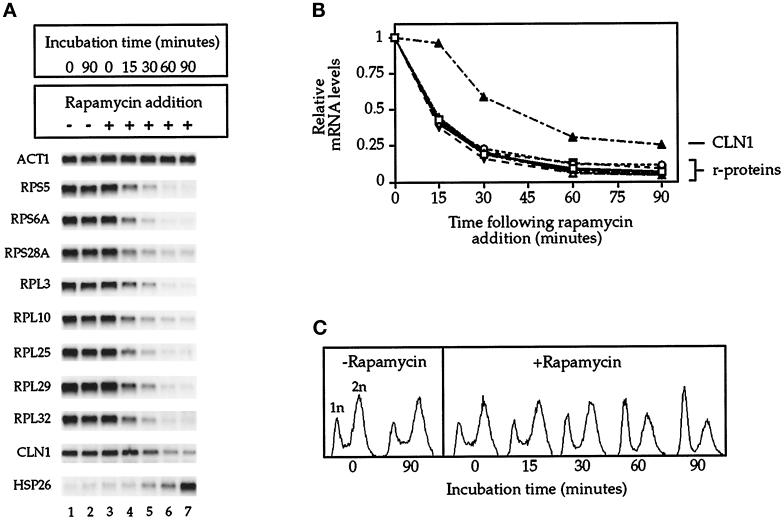
Time course of rapamycin treatment. (A) Northern blot analysis of specified mRNAs isolated from cells incubated with or without rapamycin for the period of time indicated. (B) Quantitation of data from A, with mRNA levels normalized to ACT1 mRNA. (C) Flow cytometric analysis of cells isolated during the time course, with 1n and 2n denoting haploid and diploid cells, respectively.

