Figure 7.
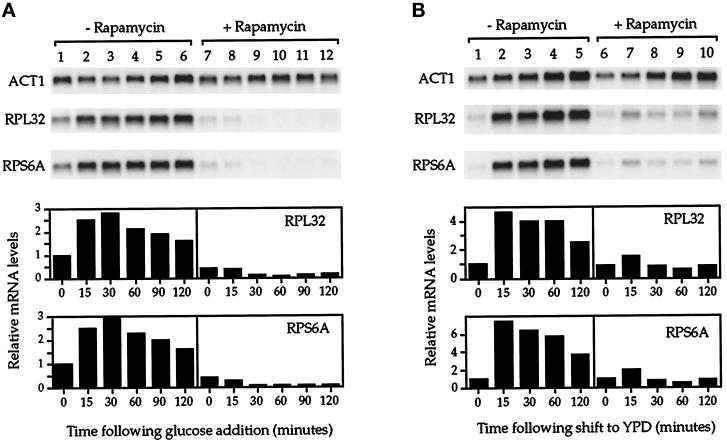
Rapamycin inhibits r-protein gene induction in response to improved nutrient conditions. (A) Glucose upshift experiment. Cells were grown in SC ethanol media to 0.4 OD600/ml. The culture was then split into two, and either drug vehicle alone (lanes 1–6) or rapamycin (lanes 7–12) was added to each half, followed by a 10-min incubation. Glucose was then added to a final concentration of 2% (wt/vol) at time 0, and RNA was prepared from samples taken at the indicated intervals and analyzed by Northern blotting (top). (B) Recovery from starvation experiment. Cells were grown in YPD to 0.4 OD600/ml and then harvested by centrifugation, washed, resuspended in starvation media, and incubated for 12 h. At this point the culture was split into two, and either drug vehicle alone (lanes 1–5) or rapamycin (lanes 6–10) was added to each half, followed by a 10-min incubation. Cells from each culture were then pelleted and resuspended into YPD again, and samples were subsequently taken at the indicated intervals. RNA was then prepared and analyzed by Northern blotting (top). In A and B, quantitation of r-protein mRNA levels is presented, normalized to ACT1 mRNA levels (bottom).

