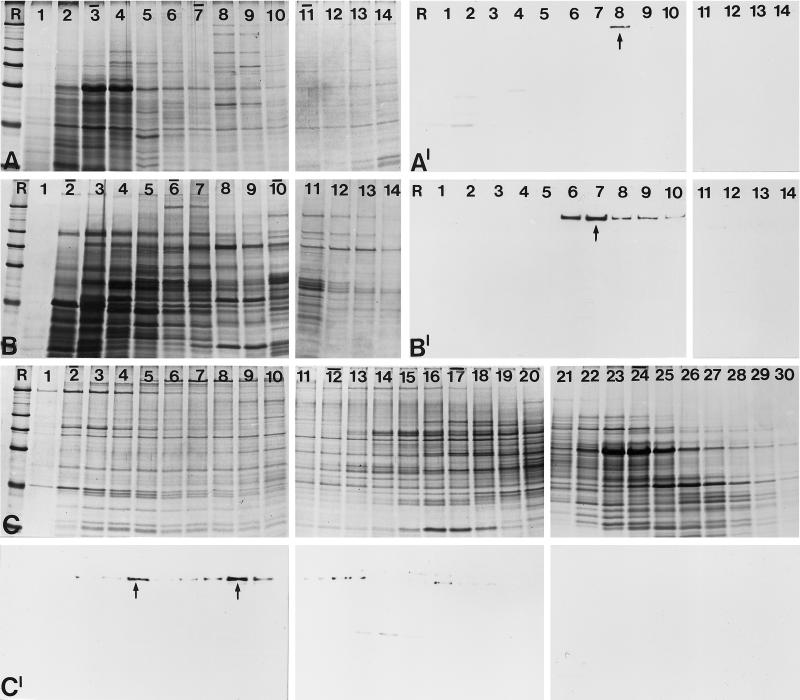
Figure 5.
Analysis of the native state of the 146-kDa protein by sucrose gradient centrifugation and gel filtration. (A) Cell lysates of Xenopus A6 cells were fractionated after sucrose gradient centrifugation, separated by SDS-PAGE, and stained with Coomassie blue. Fraction numbers are indicated on top of the lanes (the top of the gradient is on the left). Bars indicate the peak positions of the reference proteins bovine serum albumin (4.3S; fraction 3), catalase (11.3S; fraction 7), and thyroglobulin (16.5S; fraction 11). R, reference proteins are the same as in Figure 2. (A′) Corresponding immunoblot using antibody B2.4–1. The 146-kDa protein is recovered in fraction 8 with a sedimentation coefficient of ∼12S. (B) A similar study was performed with a Xenopus egg extract. Coomassie blue staining of the resulting protein fractions after sucrose gradient centrifugation. (B′) Corresponding autoradiogram showing immunochemical detection of the 146-kDa protein in fractions 7–10. The bulk of the protein is recovered in fraction 8, which corresponds to a mean S value of 12.5. (C) Proteins from Xenopus A6 cell lysates were fractionated by gel filtration, separated by SDS-PAGE, and stained with Coomassie blue. Bars on top of the lanes indicate the peak positions of the cofractionated reference proteins: dextran blue (Mapp 2,000,000; fraction 2), thyroglobulin (Mapp 669,000; fraction 12), ferritin (Mapp 440,000; fraction 17), and catalase (Mapp 232,000; fraction 24). (C′) Corresponding immunoblot with antibody B2.4–1. The 146-kDa protein is detectable in fraction 5 and fractions 8–10 (main peaks are denoted by arrows), corresponding to Mapp 1,400,000 and 1,000,000, respectively.

