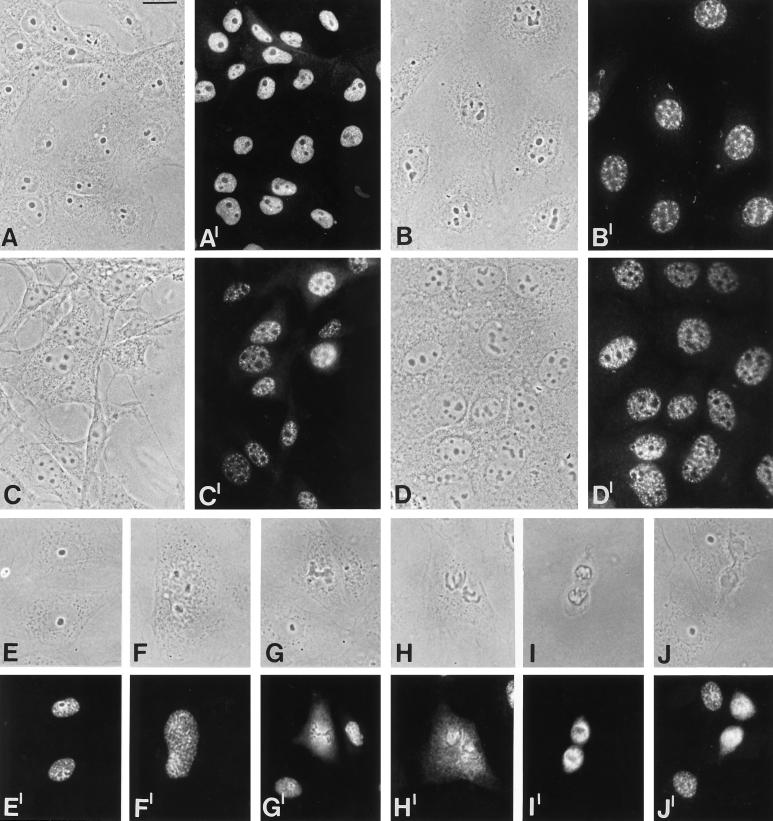
Figure 6.
Immunolocalization studies in cultured cells from different species. Phase contrast micrographs are shown in A–J and the corresponding immunofluorescence micrographs in A′–J′. (A and A′) Xenopus kidney epithelial cells, line A6. (B, and B′) Bovine mammary gland-derived cells, line BMGE+H. (C and C′) Embryonal mouse line 3T3-L1. (D and D′) Human primary liver carcinoma line PLC. (E–J and E′–J′) Distribution of the 146-kDa protein during mitosis in rat kangaroo cells, PtK2; (E and E′) interphase; (F and F′) prophase; (G and G′) metaphase; (H and H′) late metaphase; (I and I′) anaphase; (J and J′) telophase. Bar, 20 μm

