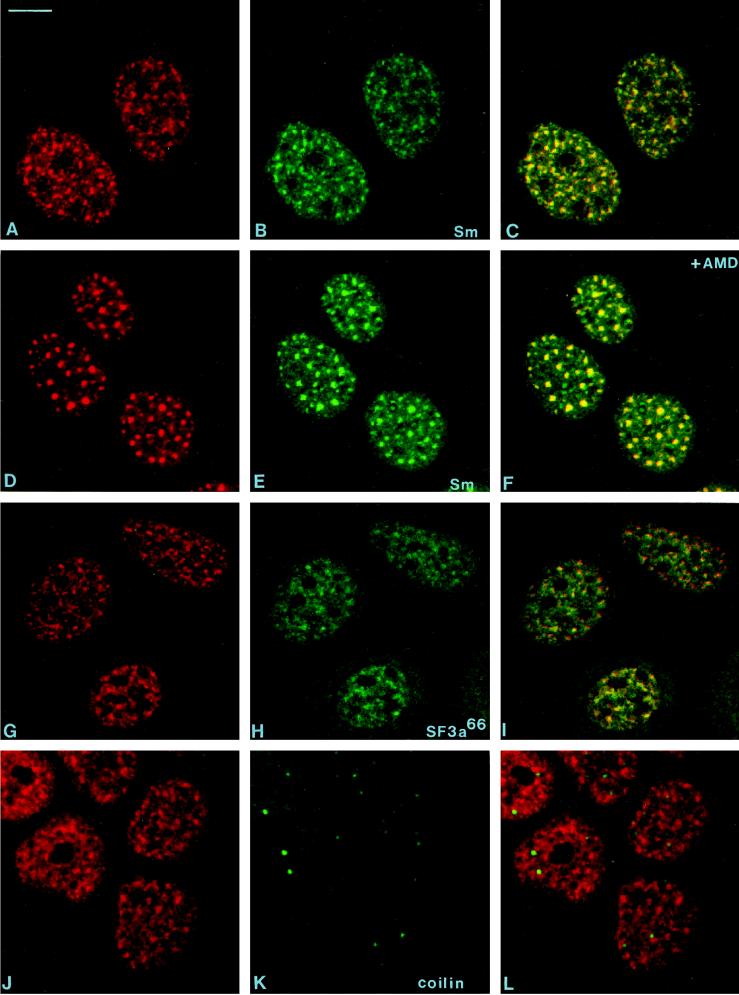
Figure 8.
Laser scanning confocal microscopy of double-labeling experiments. The distribution of the 146-kDa protein (A, D, G, and J; antibody B2.4–1) was compared with that of snRNP-specific (Sm) proteins (B and E; mAbY12), the protein splicing factor SF3a66 (panel H; mAb66), and the coiled body-specific protein coilin (panel K; anticoilin). The corresponding overlays are shown in panels C, F, I, and L. The cells shown in panels D–F were treated for 4 h with AMD (5 μg/ml). Bar, 10 μm

