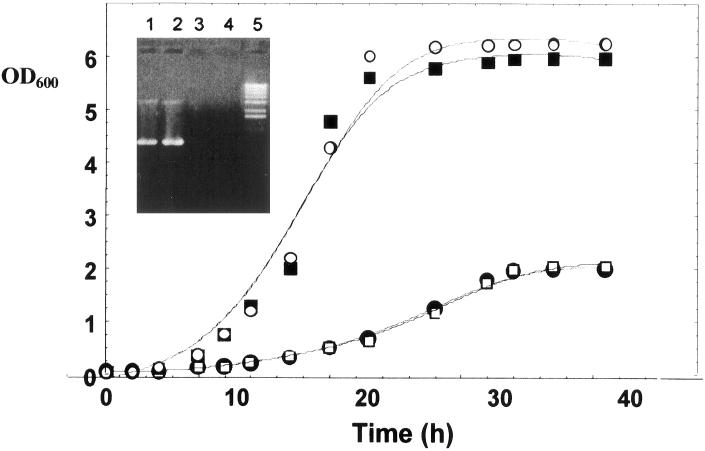
Figure 6.
Effect of GT expression on the Kre5− phenotype. Growth of HH3 cells (open circles), of a kre5::HIS3 mutant derived from it (OCY6) transformed with YEp352 (full circles), with pKRE5 (full squares) or with p425GPD-gpt1+ (open squares). Inset, RT-PCR analysis of RNA synthesized by two clones of kre5 mutant cells transformed with p425GPD-gpt1+. Primers used corresponded to the end fragments of the 665-bp 3′-terminus of gpt1+ (see MATERIALS AND METHODS). Lanes 1 and 2, complete system; lanes 3 and 4, omission of reverse transcriptase; lane 5, molecular weights markers.

