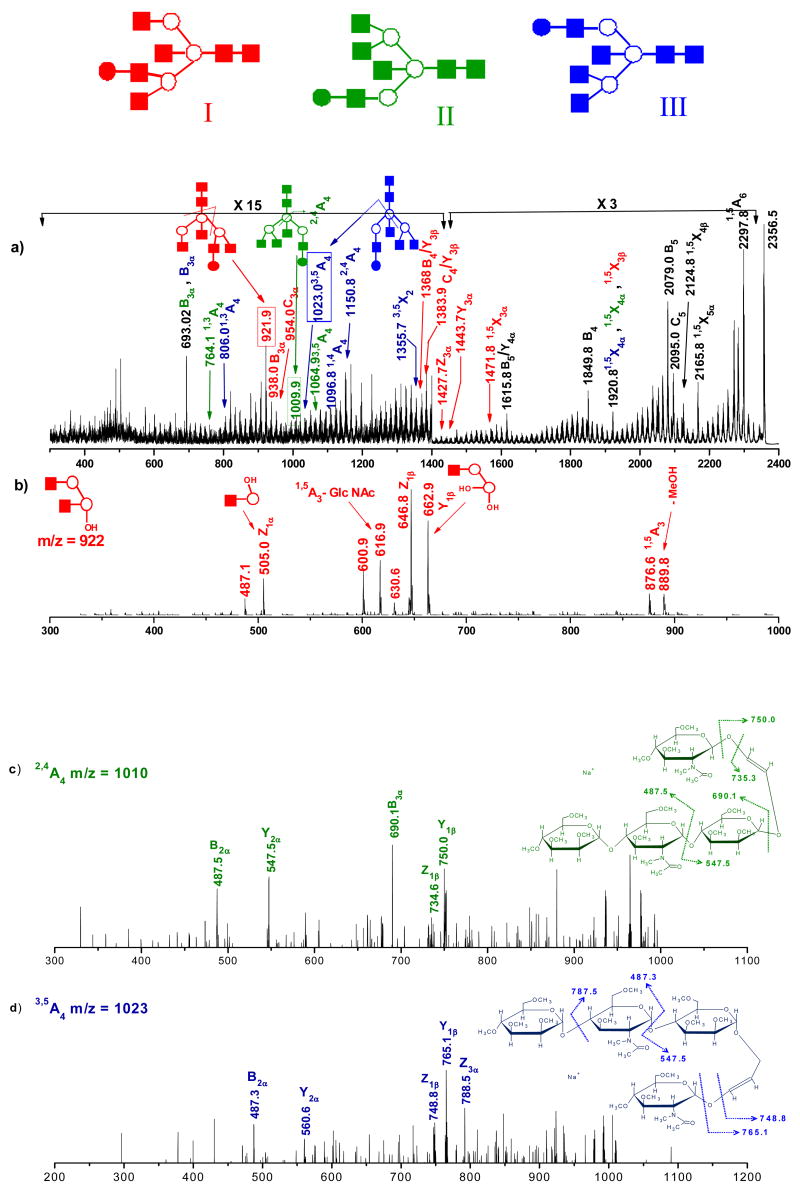
Figure 6.
(a) MS2 photodissociation spectrum of [M+Na]+ permethylated glycan precursor m/z 2356 (from ovalbumin). MS3 CID spectra of photofragments m/z (b) 921 (c) 1009 (d) 1023 generated from ion m/z 2356. Ions due to multiple cleavage sites are designated with a slash between the sites of cleavage. All fragments contain sodium. Note the changes in vertical scale within the spectrum.

