
Figure 2.
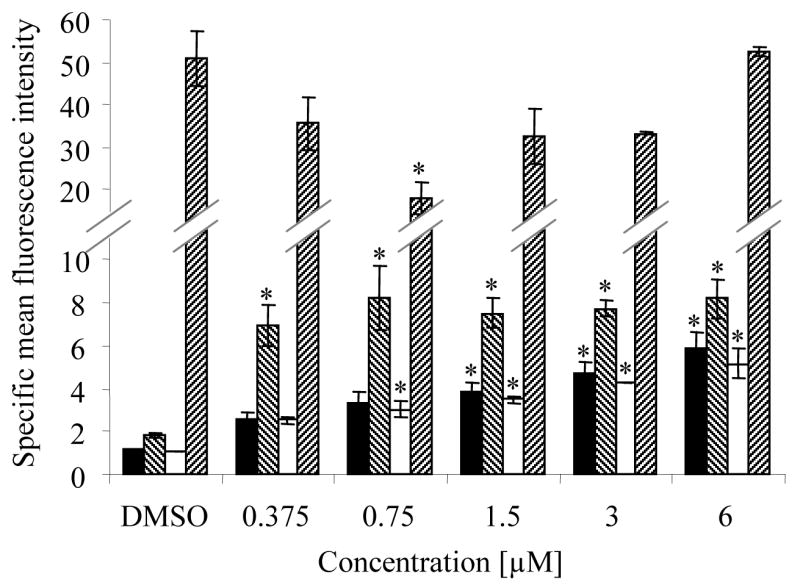
Effect of zapotin (1) on the membrane phenotype of HL-60 cells. As described in the Experimental Section, cells were induced to differentiate with the indicated concentrations of zapotin (1) using a 4-day protocol, and then analyzed for the following membrane markers of differentiation: CD11b (■), CD13 (▧), CD14 (□), and CD15 (▨). Results are expressed as the specific mean fluorescence intensity (ratio of antigen antibody fluorescence over isotype antibody fluorescence), and represent the mean of two independent studies.
* Significantly different from control values (p < 0.05).