
Figure 4.
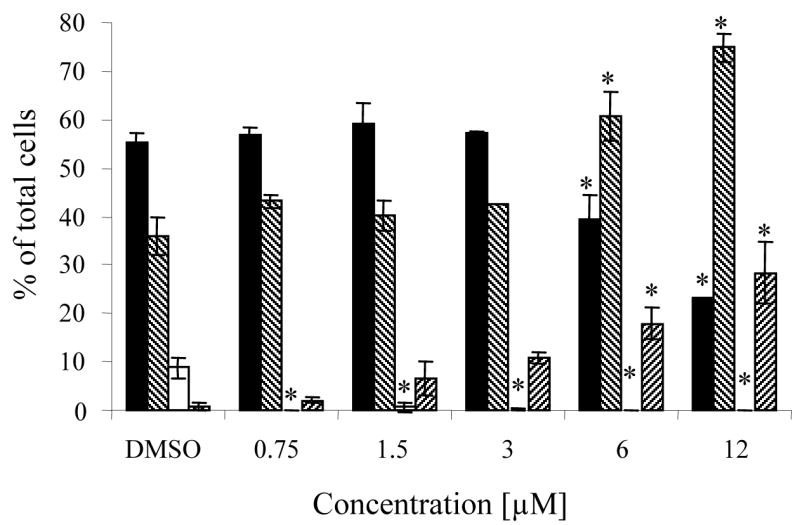
Cell cycle effects of zapotin (1) in HL-60 cells. Cells were treated with the indicated concentrations for 24 h, fixed in ethanol and stained with PI (propidium iodide) for flow cytometric analysis, as described in the Experimental Section. Values are expressed as percentage of total cells and represent the mean ± SD of three determinations, for the following compartments of the cell cycle: G1 (■), S (▧), G2/M (□) and apoptotic peak sub G1 (▨).
* Significantly different from control values (p < 0.01).