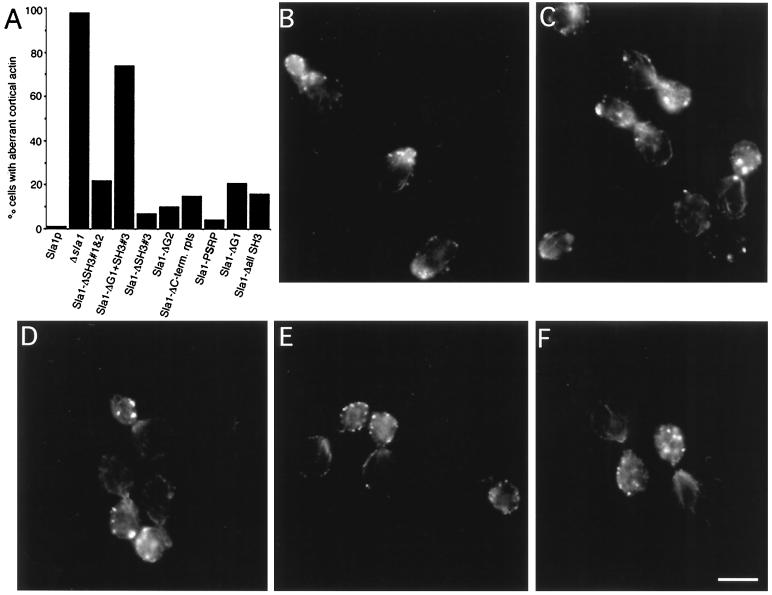
Figure 7.
Actin organization in cells expressing mutant forms of Sla1p. Log-phase cells were processed for Rd–phalloidin staining. (A) For each mutant at least 300 cells were scored for wild-type or aberrant actin patch morphology. Representative images of actin staining are shown for cells expressing (B) wild-type Sla1p, (C) no Sla1p, (D) Sla1-ΔG1+SH3#3, (E) Sla1-ΔC-terminal repeats, (F) Sla1-ΔSH3#1&2. Bar, 5 μm.

