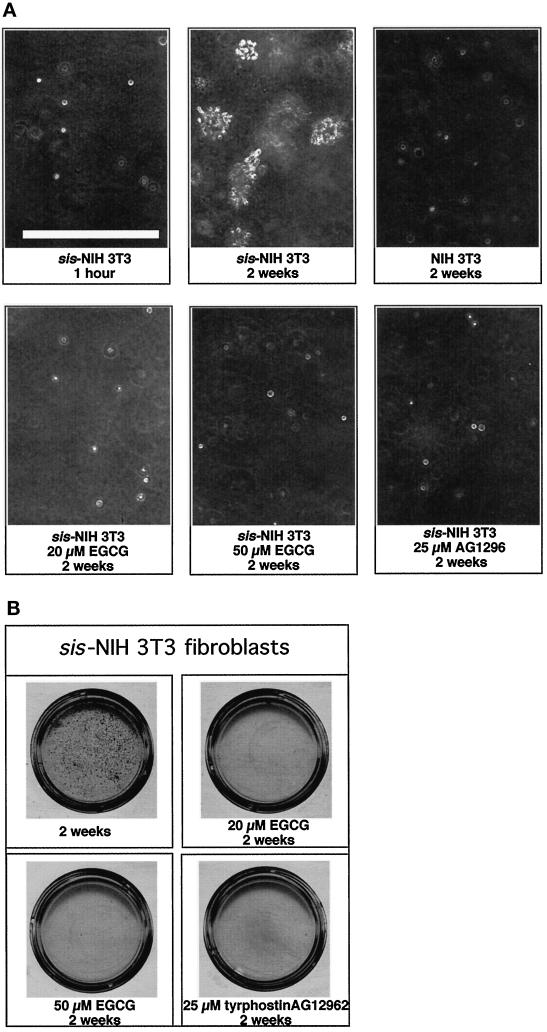
Figure 10.
Anchorage-independent growth of sis-transfected NIH 3T3 cells in the presence and absence of EGCG or tyrphostin AG1296. (A) Single cells (5 × 10⁴) in 1.5 ml of MEM supplemented with 0.35% agar, 10% FCS, and 20 μM or 50 μM EGCG or 25 μM tyrphostin AG1296 were plated in 35-mm Petri dishes on a layer of 1 ml of 0.7% agar containing MEM supplemented with 10% FCS, 20 μM, 50 μM EGCG, or 25 μM tyrphostin AG1296. Representative fields were photographed after 1 h hour and 2 wk by phase-contrast light microscope. Bar, 250 μm. (B) Petri dishes (35-mm diameter) containing the visible colonies of sis-NIH 3T3 fibroblasts were scanned with a SnapScan 600 scanner (AGFA, Cologne, Germany) by the inverted modus, and scans were analyzed by the Adobe photoshop software (Adobe Systems, San Jose, CA).

