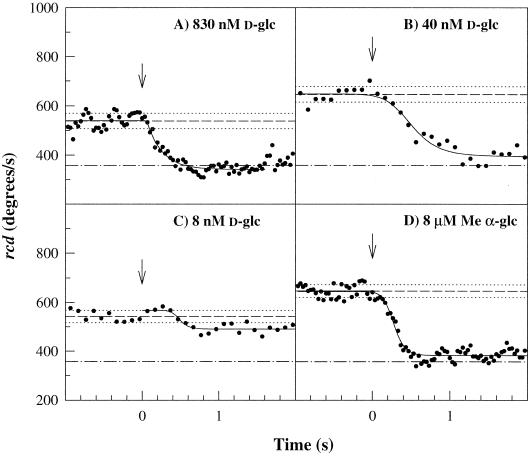
Figure 3.
PTS chemotactic response sensitivity. Wild-type JWL184–1 responses. (A) 0.83 ± 0.09 μM d-glc; kex = 4.9 ± 0.4 s−1. (B) 40 ± 3 nM d-glc. (C) 4 ± 0.3 nM d-glc. (D) 8 ± 0.2 μM α-methyl glucoside. Note the lag preceding the rcd decrease, evident in c and less so in b and d. t1/2 values were ∼500 ms for b and c and 250 ms for d, respectively. Arrows and reference lines are as in Figure 2.

