Figure 5.
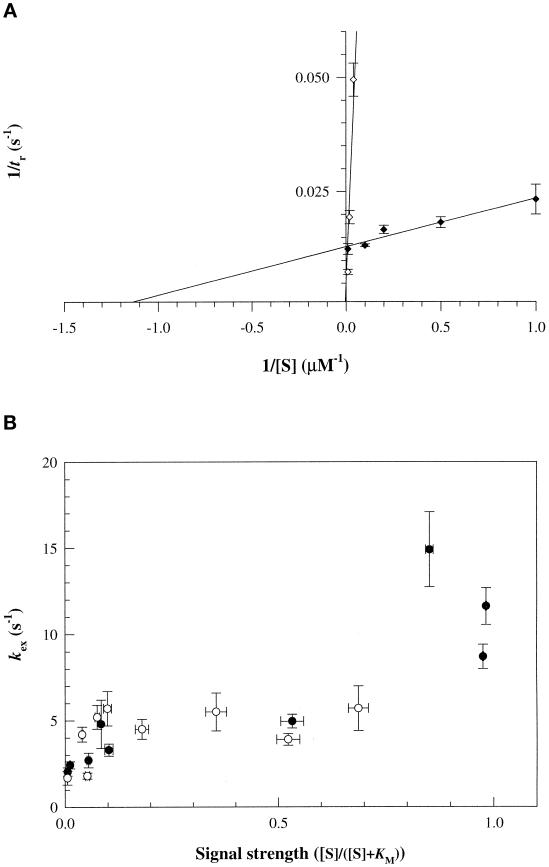
Adaptation and excitation kinetics of the positive PTS signal. d-glc (closed circles); Me α-glc (open circles). (A) Reciprocal plots of JWL184–1 tethered cell transition times, tr (±SE), versus substrate concentration. Responses at other d-glc or Me α-glc concentrations were normalized by responses to 10 μM d-glc determined for each experiment. The latter had a mean tr of 75 ± 1.8 s. Each data point typically represents results of two independent experiments (20–50 cells/experiment). (B) Excitation response rates, kex, determined from photorelease assays, plotted against signal strength.

