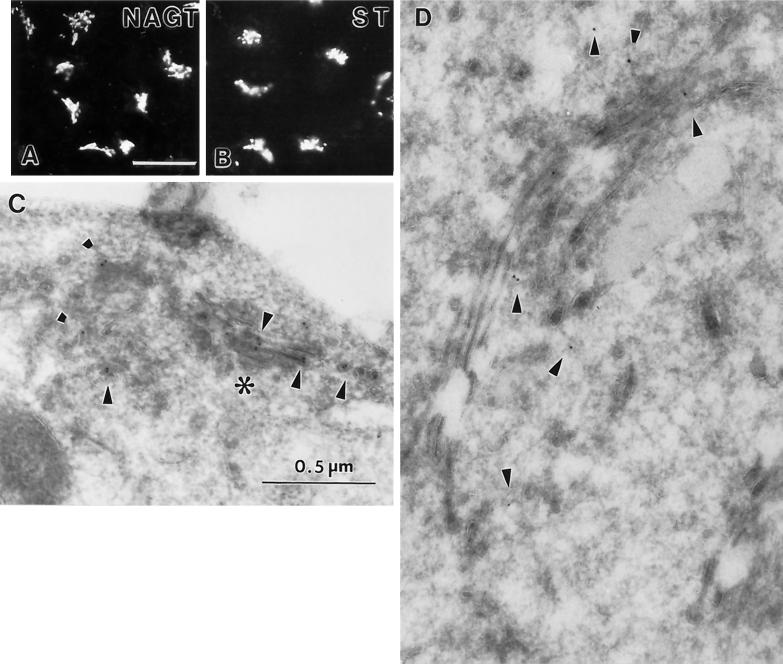
Figure 1.
Single-label immunolocalization of NAGT-I- and ST-myc stably expressed in Vero cells. Immunofluorescence distribution of NAGT-I- (A) and ST-myc (B). Bar, 20 μm. Immunogold distribution of NAGT-I- (C) and ST-myc (D). Bar, 0.5 μm. Arrowheads point to gold particles. Asterisk (C) indicates a region of the Golgi complex in which the organelle is sectioned perpendicularly to the stack while to the left the section falls obliquely giving rise to a tubular-vesicular appearance. 9E10 mAb was the primary antibody. For immunofluorescence, a Texas Red-conjugated secondary antibody was used.

