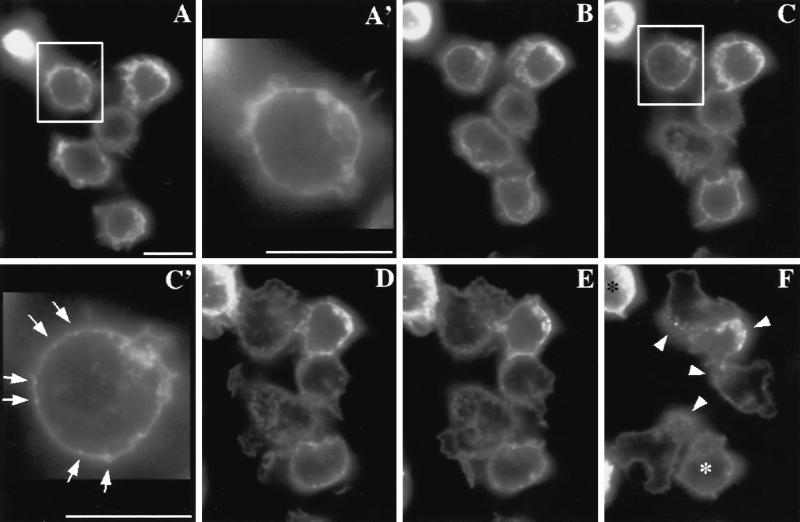
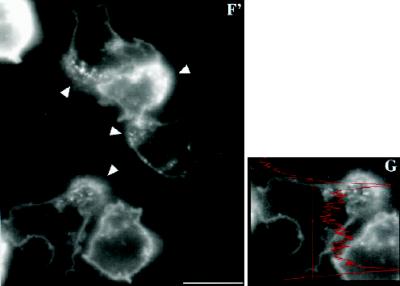
Figure 4.
C5aR–GFP dynamics after stimulation of PLB-985 cells with a uniform concentration of C5a. C5aR-GFP–expressing PLB-985 cells were differentiated with 1.3% DMSO, plated on glass coverslips, and exposed to a uniform concentration (20 nM) of C5a in mHBSS; images were recorded every 2 s, under pseudoconfocal conditions, as described in MATERIALS AND METHODS. Responses are shown after (A) 0, (B) 28, (C) 56, (D) 140, (E) 168, and (F) 308 s. Panels A′ and C′ show magnifications of the cells indicated in panels A and C, respectively. Panel F′ shows a magnification of panel F. Panel G shows a fluorescence intensity scan analysis of the cell in the lower left corner in panels F and F′. Arrows point to agonist-stimulated receptor patches. Arrowheads (in F and F′) point to internalized receptors located in the uropod of polarized cells. The asterisks in panel F indicate cells that spread but did not clearly develop a polarized morphology after stimulation. This session is representative of three similar observations. Bar, 10 μm. A video of the experiment described in this figure is available on the internet version of this paper, at http://www.molbiolcell.org.


