Figure 5.
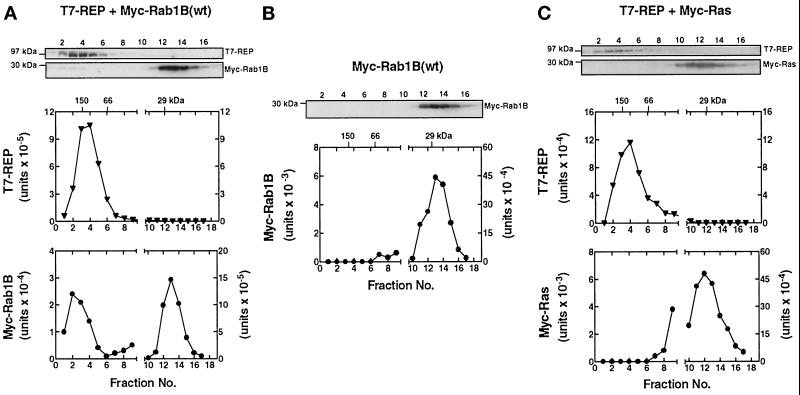
Gel filtration assay detects a complex between nascent Myc-Rab1B and T7-REP in HEK-293 cells. Parallel cultures were cotransfected with plasmids encoding T7-REP and Myc-Rab1B (A), Myc-Rab1B alone (B), or T7-REP and Myc-Ras (C), and the cells were maintained in medium containing 10 μM lovastatin for 48 h. Cell lysates were prepared and subjected to FPLC on a Superose-12 column as described in MATERIALS AND METHODS. Individual fractions were subjected to SDS-PAGE and immunoblot analysis using monoclonal antibodies against the T7 and Myc epitopes of the overexpressed proteins. The graphs show the results obtained when bound 125I-labeled IgG was quantified by phosphorimager analysis. Peak elution positions of the marker proteins, alcohol dehydrogenase (150 kDa), bovine serum albumin (66 kDa), and carbonic anhydrase (29 kDa), are indicated at the top. Early fractions corresponding to the exclusion volume and markers above 200 kDa did not contain Myc- or T7-immunoreactive proteins and are not shown. It should be noted that in the Myc-Rab1B and Myc-Ras panels, the scale of the y-axis on the left side is expanded one order of magnitude compared with the right side.

