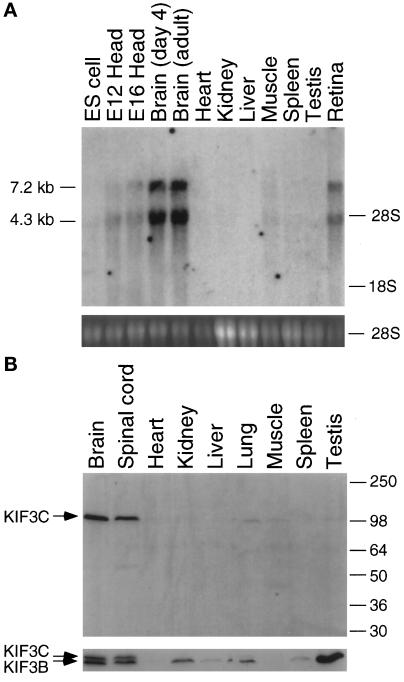
Figure 2.
Analysis of expression of KIF3C in mouse tissues and cell lines. (A) Analysis of KIF3C transcripts in mouse tissues or cell lines by Northern blots. Upper panel shows that two transcripts of 7.2 and 4.4 kb were detected in brain and retina. Lower panel is ethidium bromide staining of 28S ribosomal RNA as a control for integrity and loading of total RNA from all tissues and cell line. ES cell: embryonic stem cell. E12, E16: mouse embryo heads at day 12 and day 16, respectively. (B) Analysis of KIF3C expression in mouse tissues by Western blots. The same blots were first probed with anti-KIF3C (upper panel), then stripped and probed with anti-KIF3BC (lower panel).

