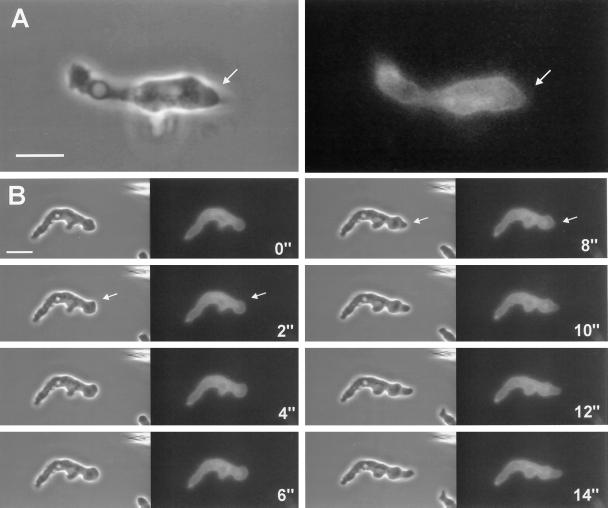
Figure 6.
Dynamics of subcellular localization of GFP–RacF1 in aggregation-competent cells. Cells were starved for 6 h, allowed to sit, and stimulated with a micropipette filled with 0.1 mM cAMP. Images were taken using a double-view microscope system as described in MATERIALS AND METHODS. Each pair of images is composed of a phase-contrast (left) and a fluorescence (right) image. Image of a single cell (A) and time series (B) of a cell migrating toward the pipette, which is visible at the top right of the phase contrast image. Outbreaking protrusions (arrows) are not filled with GFP–RacF1. Bar, 10 μm.

