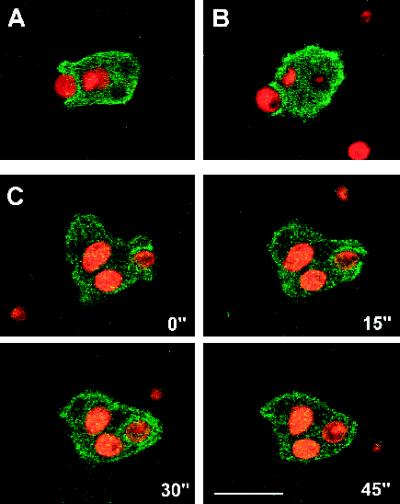
Figure 8.
Localization of GFP–RacF1 during phagocytosis of yeast cells. Dictyostelium cells were allowed to sit on glass coverslips and challenged with TRITC-labeled yeast cells. Images were taken with a confocal laser scanning microscope. Images from green and red channels were independently attributed with color codes (green for GFP and red for TRITC) and superimposed. (A and B) Accumulation of GFP–RacF1 at the phagocytic cup. (C) Time series showing the dynamics of GFP–RacF1 redistribution on uptake of a yeast cell. GFP–RacF1 fluorescence localizes around the ingested particle only at early stages of phagocytosis. Bar, 10 μm.

