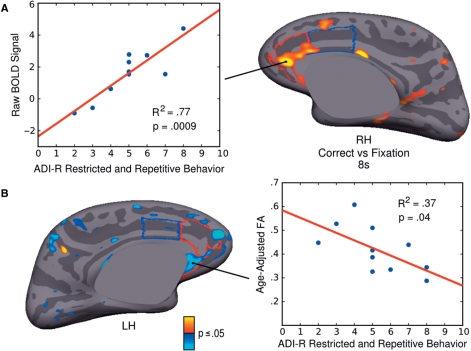
Fig. 5.
Relations of ACC function and structure to restricted, repetitive behaviour in ASD. (A) Statistical map of regression of raw BOLD signal on ADI-R repetitive behaviour score. BOLD signal is from the correct antisaccade versus fixation contrast at 8 s. Results are displayed on the inflated right medial cortical surface. Scatter plot shows BOLD signal from the maximum vertex in right rACC for each ASD participant on the y-axis and ADI-R score on the x-axis. (B) Statistical map of regression of FA on ADI-R repetitive behaviour score. Results are displayed on the inflated left medial surface. Scatter plot shows FA from the maximum vertex in left rACC for each ASD participant on the y-axis and ADI-R score on the x-axis. The rACC is outlined in red and the dACC is outlined in blue.

