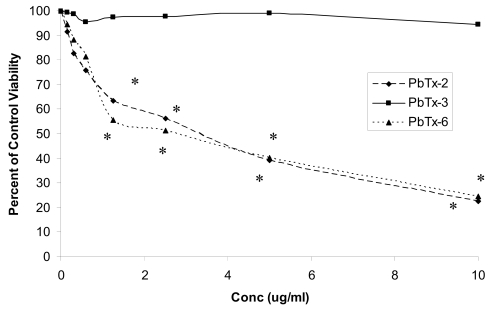
Figure 1.
Percent viability of Jurkat cells treated with PbTx-2, PbTx-3, or PbTx-6 for 24 h. Data are represented as percent of ethanol control viability. Cells treated with PbTx-2 or PbTx-6 had significantly lower viability compared to corresponding ethanol controls and compared with viability of cells treated with PbTx-3 at concentrations indicated by *. Statistical differences compared to ethanol controls were determined using a t-test at each toxin concentration. Comparisons in viabilities among toxin congeners were determined using one-way ANOVA at each concentration. N=4.

