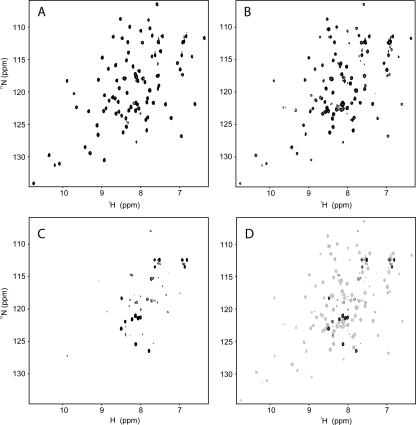
Figure 1.
15N-HSQC spectra of CTHAP (A), GST-CTHAP (B), and GST alone (C). (D) Overlay of the spectra of GST-CTHAP (gray) and GST (black). All spectra were acquired at 298 K and pH 6.5 on samples in 20 mM NaH2PO4, 100 mM NaCl, 1 mM DTT. Spectra were recorded on a Bruker AMX 600 spectrometer equipped with a cryogenically cooled probe and with a relaxation delay of 1 s, an acquisition time of 100 ms, and 4 scans per t 1 increment. The signal-to-noise ratio of the spectrum of GST-CTHAP (B) is approximately fourfold lower than that of the spectrum of CTHAP alone (A).

