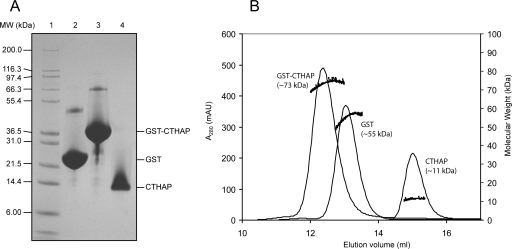
Figure 2.
Molecular weight estimates of CTHAP, GST-CTHAP, and GST. (A) SDS-PAGE analysis showing Mark12 protein standards (lane 1), GST (lane 2), GST-CTHAP (lane 3), and CTHAP alone (lane 4). (B) Size-exclusion chromatography of CTHAP, GST-CTHAP, and GST alone (chromatograms overlaid). Molecular weight of each protein was estimated using an in-line MALLS detector. MALLS data are shown as black dots.

