
Figure 5.
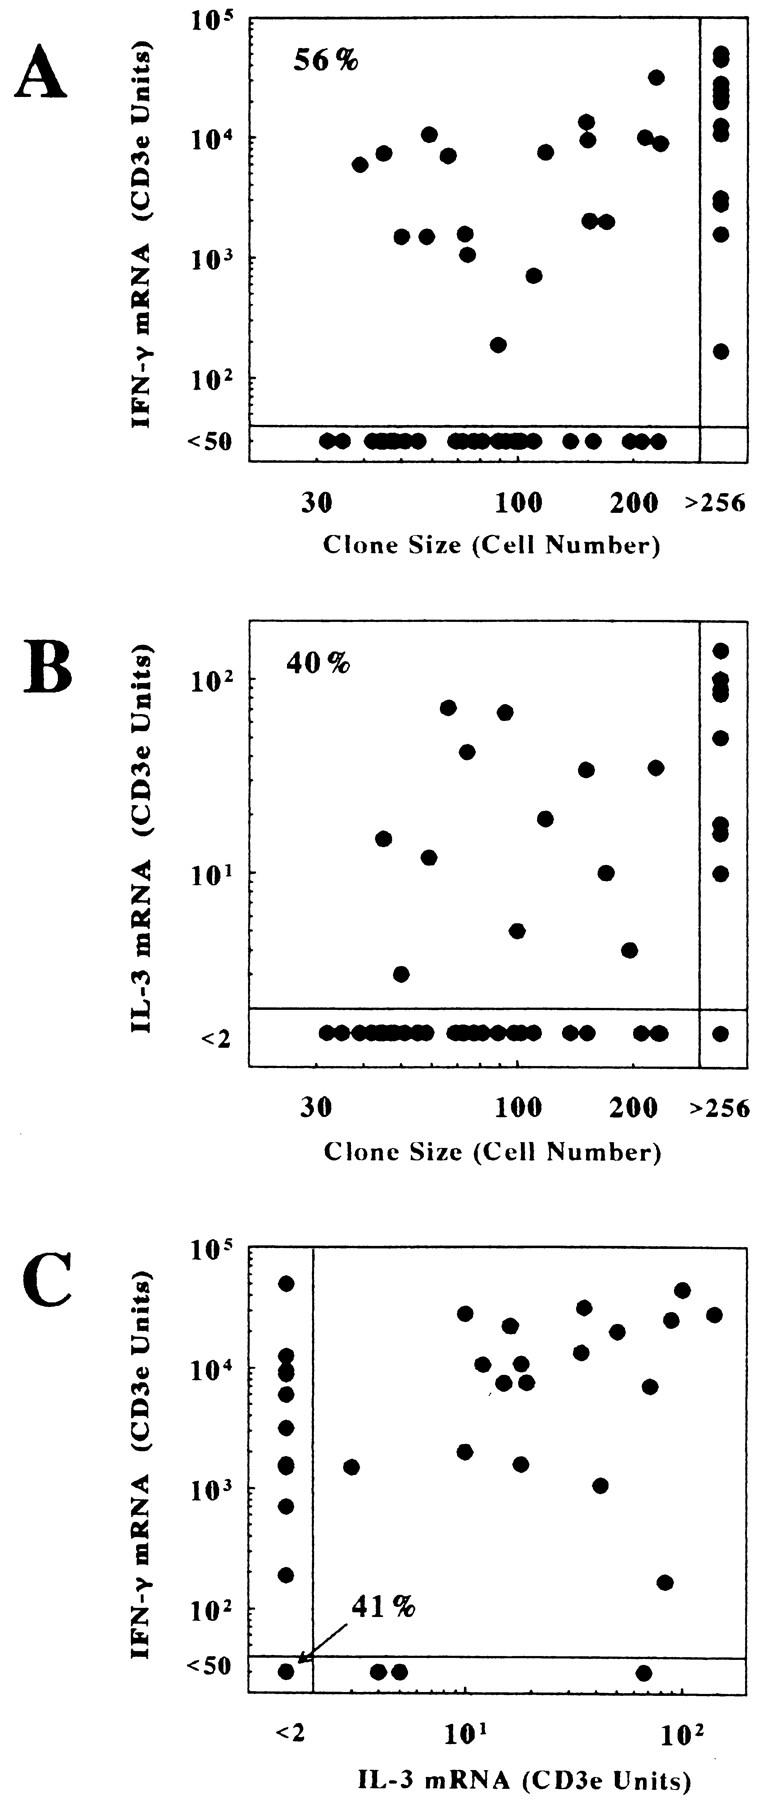
Quantitation of IFN-γ and IL-3 mRNA levels in a panel of CD8+ clones by competitive PCR after 4–5 d of stimulation. Levels of mRNA were determined by QCPCR and corrected for CD3ε mRNA levels as described in Materials and Methods. A shows relative IFN-γ mRNA levels in relation to clone size. B shows relative IL-3 mRNA levels in relation to clone size in the same set of clones. C shows the relationship between IFN-γ and IL-3 expression levels for each clone in the panel. The results for 53 clones are shown.